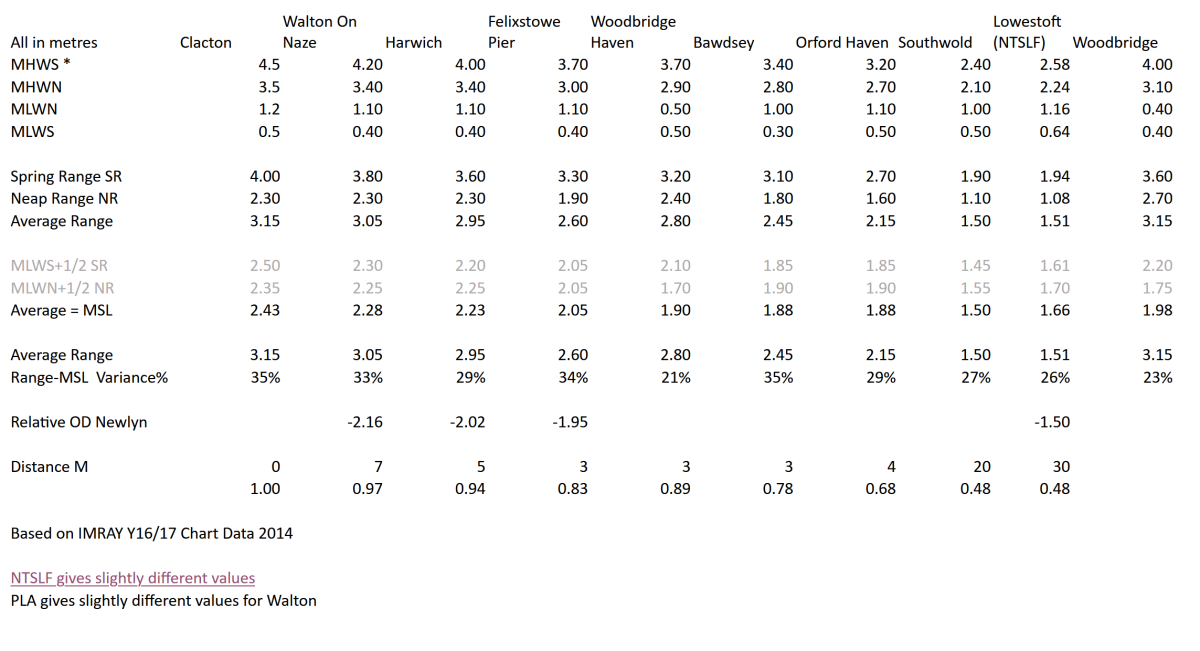
Also see Walton on the Naze tides – variation
LIDAR is a Laser-based surveying technique that provides elevation data across a land area. There are various types of survey data that can be downloaded and then processed to show a given area. The raw data will include buildings and vehicles, this is the DSM version. Processing is done to remove these and just give the terrain, this is the DTM version. The height is expressed in metres above the Ordnance Datum (AOD), and depressions are negative. This is essentially the Mean Sea Level (MSL) for the area. The precision of the data varies, large areas tend to be in large horizontal squares and small areas in more precise squares or tiles, these can be as small as 0.5m square.
Bathymetry data is available from Admiralty and other sources, this is expressed in metres below Chart Datum (negative) with drying heights positive: DEFRA has a small selection of multibeam bathymetry with 0.5m resolution (OSGB and .asc files).
Data Sources
- DEFRA Portal with LIDAR and some Bathymetry. All Bathymetry data is in ASCII format, which do not contain header information listing the Coordinate Reference System. All LiDAR available on the DSP is available in GeoTIFF format which features embedded projection information. All data available on the DSP is in OSGB36 format. Elevations recorded above Ordnance Datum Newlyn (AODN).
- Also EU 25m DEM – low resolution but good for wide areas from Copernicus Portal.
- Best for bathymetry Admiralty UKHO
- UKDMOS is the United Kingdom Directory of Marine Observing Systems.
- Portal Medin Portal Chart Datum.
- Also Copernicus marine data
- EMODnet – not so good as above.
- seascapes_southwold-clacton_FINAL_REPORT
- National Tidal and Sea Level Facility (ntslf.org)
- British Oceanographic Data Centre (BODC) — oceanographic and marine data
Detail on surveys and precision. Much local info on sea level, tide, temperature etc. in the Coastal Monitoring reports. See this one.
Excellent UKHO Guide on Bathymetry.
Note: Add CSV file to QGIS as delimited text. Set Lat, Long, and Depth fields. Then use the contour plugin to generate contours.
DEM of Seabed
The only DEM found for offshore is here. OpenDEM which leads to GEBCO data download
OD vs CD
Because the range of tidal height around MSL varies, generally larger going south, the relationship between Ordnance Datum and Chart Datum is variable with the correction ranging from Sheerness -2.9m to Lowestoft -1.5m. This needs to be added algebraically to Height OD to get to CD. For local -2m is a reasonable approximation.
For this and other reasons, it is not straightforward to combine Bathymetry and LIDAR data along the coast. Fortunately, there is a dataset called Surfzone, which merges the land and sea-based data for most of the coastline that is of interest. To use tidal data with this it is necessary to adjust for the difference in OD and CD at that location.
MSL is equivalent to OD Newlyn (it might have been Felixstowe, but Newlyn got the job)1MSL history – see Maritime ArchaeologyTrust
Felixstowe Ordnance Datum is Newlyn -1.95m, Lowestoft is Newlyn -1.5m2NTSLF Chart datum & ordnance datum | National Tidal and Sea Level Facility (ntslf.org)
If for example, you have a tidal height for Felixstowe of 10m above CD and want to convert it to be relative to OD, then 1.95m tidal height (i.e. MSL) – 1.95 = 0m AOD or 10m + ( -1.95m ) = 8.05m
Chart Datum of Harwich Harbour, a level of 2.02 metres (6.62 feet) below Ordnance Datum (Newlyn), is approximately 0.1m above the level of the lowest astronomical tide.
Chart Datum of Walton on Naze a level of 2.16 metres ( 7.09 feet) below Ordnance Datum Newlyn.
Chart Datum of Woodbridge should be about half of Spring Range=1.8m below Ordnance Datum Newlyn.
From Suffolk SMP2 Sub-cell 3c Policy Development Zone 6 – Orford Ness to Cobbold’s Point.
Harwich Area Tidal Range
Sea level at Woodbridge – GOV.UK (check-for-flooding.service.gov.uk)

Historical W-o-N from PSMSL Data and Station Information for WALTON ON THE NAZE (psmsl.org)
Here are surge forecasts for Felixstowe for 48 hours ahead.
Sea Level Changes
Historic variations in Sea Levels Part 1- from the Holocene to Romans
A logical discussion of why the high tide mark in Anglo Saxon times was 5 metres higher(Pevensey).
British Roman Ports miles away from the coast – Prehistoric Britain
The 1,800-year oceanic tidal cycle: A possible cause of rapid climate change
Coastal Trends Report Essex (Subcell 3d – Harwich to Canvey Island) July 2008 RP008E2008.pdf
Changes in mean sea level around Great Britain over the past 200 years
Steward, Richard, and Robin Whittle. ‘Saltmarsh Research on the River Deben’, n.d
Colour Style for Diagrams
Generally, the interest is in the sea depth and level relative to the land. To account for the change in range then the colour set is shifted every few miles to maintain the meaning. For shallow draught vessels 2m is considered just navigable.
| CD | OD | Comment | Colour |
| -20 | Blue 6 | ||
| -15 | Blue 5 | ||
| -5 | Blue 4 | ||
| -2 | Always navigable | Blue 3 | |
| 0 | CD+Var | MSL | Blue 2 |
| 2 | Navigable HWS | Blue 1 | |
| MHWS Shoreline | Blue 0 | ||
| Surge line = MWHS+1m | Violet | ||
Notes
Questions
Sources
Footnotes
- 1MSL history – see Maritime ArchaeologyTrust
- 2
Image Sources and Credits
- 1MSL history – see Maritime ArchaeologyTrust
- 2