Essentials
- Standard air pressure at sea level is 1013 millibar (mb).
- +1mb air pressure depresses sea level by 1cm.
- -1mb air pressure raises sea level by 1cm.
- This is unlikely to matter unless precise depth is vital.
- Weather changes air pressure and dominates.
Air Pressure
Standard air pressure at sea level is 1013.25 millibar (mb) or hectopascals (hPa), they are the same1hPa the SI unit equivalent to the millibar, hecto=100, Pa = Pascal.. In the U.K. air pressure ranges from approximately 980mb in stormy weather to 1040mb in settled weather: these values can be exceeded in exceptional conditions2List of atmospheric pressure records in Europe .
Effect on sea level
Standard air density is 1.2kg/m3, increasing with pressure, and decreasing with temperature: pressure varies more in winter than in summer. The column of air from the sea to space is supported by the sea’s surface. Calculating the weight of the air column is not straightforward since the density of air decreases with height so it is easier to infer it from the known pressure.
At standard temperature and pressure, there are 10.13 tons of air pressing on each square metre of sea surface3A Pascal is equivalent to 1kg over 1m2 so there are about 10.13 tons – 1013mb/hPa=101,300Pascal=1013 hPa; 1 Pascal=1 Newton/m2/s2; 101,300/1000= 10.13 tons/m2 . The weight of this column of air is what causes the 1013mb of pressure.
Changes in this air pressure affect sea level4More precisely, Sea level change -(change in pressure) / (waterdensity*g) where g=accelleration due to gravity. Captain Lecky explains it eloquently:
Though it has been proved that water is capable of being compressed, it is the case to such a very limited extent, that for our present purpose the property may be disregarded. A forced displacement, therefore, at one point of a liquid surface, is always exactly counterbalanced by a corresponding rise at another. Conversely, a rise at any place can only be effected by a proportionate withdrawal of water elsewhere.
Wrinkles in Practical navigation5Wrinkles in practical navigation – Captain S.T.S.Lecky

The Barometer
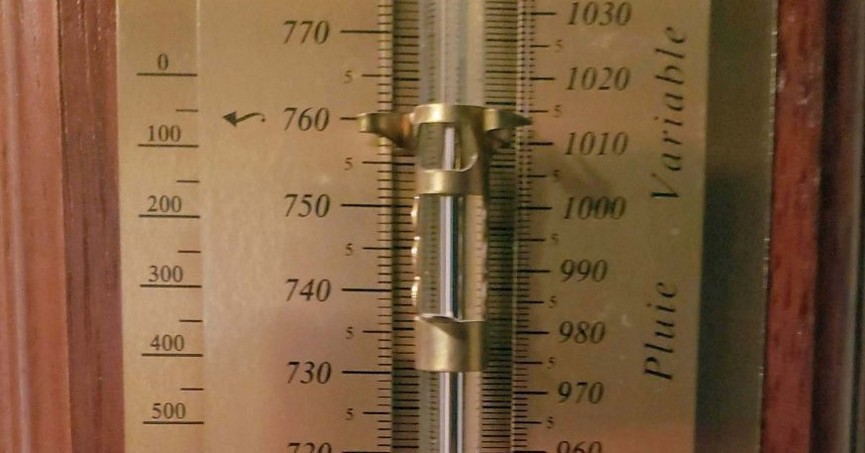
A barometer is an instrument for weighing air by comparing the air column with a column of Mercury and giving a result in millibars (the same as hectopascals). Aneroid and digital barometers do the same but with a pressure sensor.
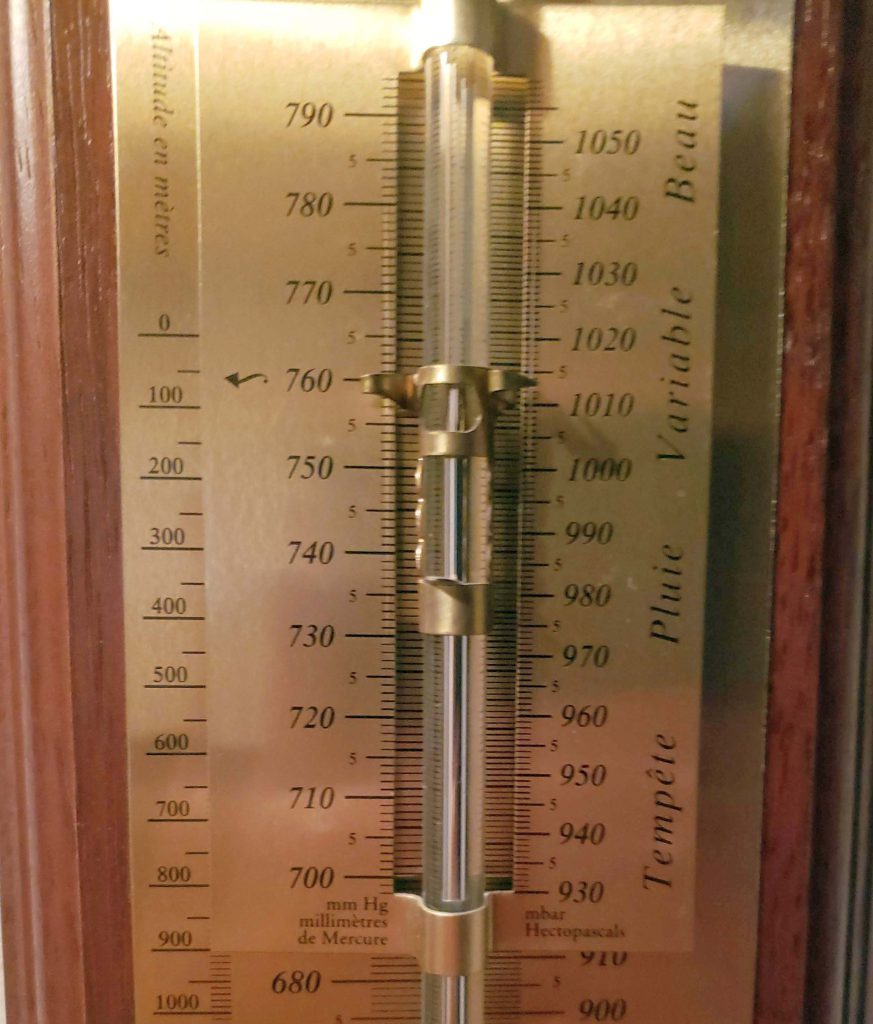
The sailor can use this information since each 10mb change in pressure theoretically results in a 10cm (4″) opposite direction change in sea level. Centimetres are not elegant units but are useful in this context.
In Imperial units, the standard was 29.91 inches of Mercury and the calculation was straightforward since one one-inch change in the barometer corresponded to one one-foot change in sea level.
- Change= minus (millibars-1013) centimetres.
- High pressure = lower sea level
- Low pressure = higher sea level.
Calculating the effect
As an example, in a period of high pressure, say 1043mb (1043-1013=30mb increase), the sea level should fall by 30cm or 1 foot. Similarly, if the pressure fell to 983mb (1013-983=30mb) then there would be a rise of the same magnitude. At a river bar or marina entrance, this might matter but should be within the safety margin allowed by a prudent sailor.
The effect is complicated by weather and sea conditions which can cause ‘surges’, so results can be unreliable. For example, in a period of high pressure, one would expect the sea level to drop but, instead, it can be elevated by even higher pressure nearby.
Surges can affect currents: a passage back from Southwold to Harwich in 2014, after an overnight negative surge followed by a positive surge, resulted in a fast trip.

To re-cap, calculate the difference in mb from 1013mb (correction for temperature has been ignored), reverse the sign and this gives sea level change in centimetres.
As air pressure reduces with altitude, a global sea level rise of 110m would make the standard pressure a more convenient 1000mb which would be easier for calculation: maybe, one day, with climate change…
Test
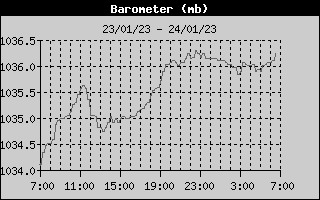
During a fairly settled few days on 23/24th January 2023 over 24 hours the average pressure at Waldringfield Sailing Club was about 1035mb. This should depress the sea level by (1035-1013= 22) x 10 = 22cm. With light northerly winds the HHA average surge was negative 12cm. This is only just over half of what was predicted but the northerlies may partly account for that.
Extremes
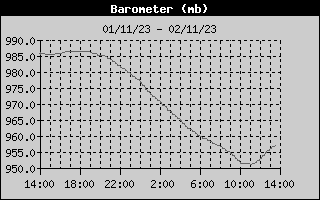
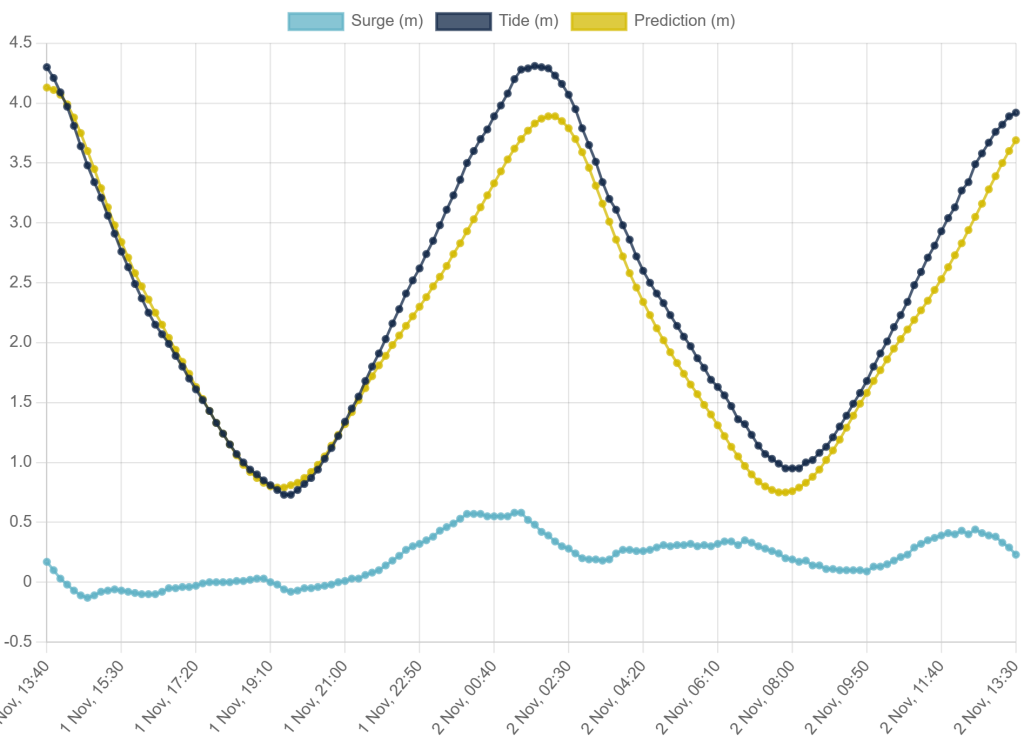
Historical U.K. extremes of 1050mb and 950mb would, theoretically, have caused a reduction of 37cm and an increase of 53cm in sea level. In practice, other meteorological effects dominate and few would be sailing in the likely conditions. For example, the storm on November 2nd 2023 caused a drop in air pressure at Harwich to 955mb and yet there was an increase in the predicted tide at Harwich.
Surges
The change in sea level due to atmospheric pressure variations can manifest as a ‘tidal surge’. These can cause a risk of flooding so are monitored. The amplitude of surges is determined by many other, weather-induced, factors so cannot be predicted by the simple 1mb/1cm relationship.
Surges can be negative and, on rare occasions, if near Low Water, reveal the sea bed which might be interesting. A key factor is how the surge relates to high and low water: it may mask or enhance the tidal effect.
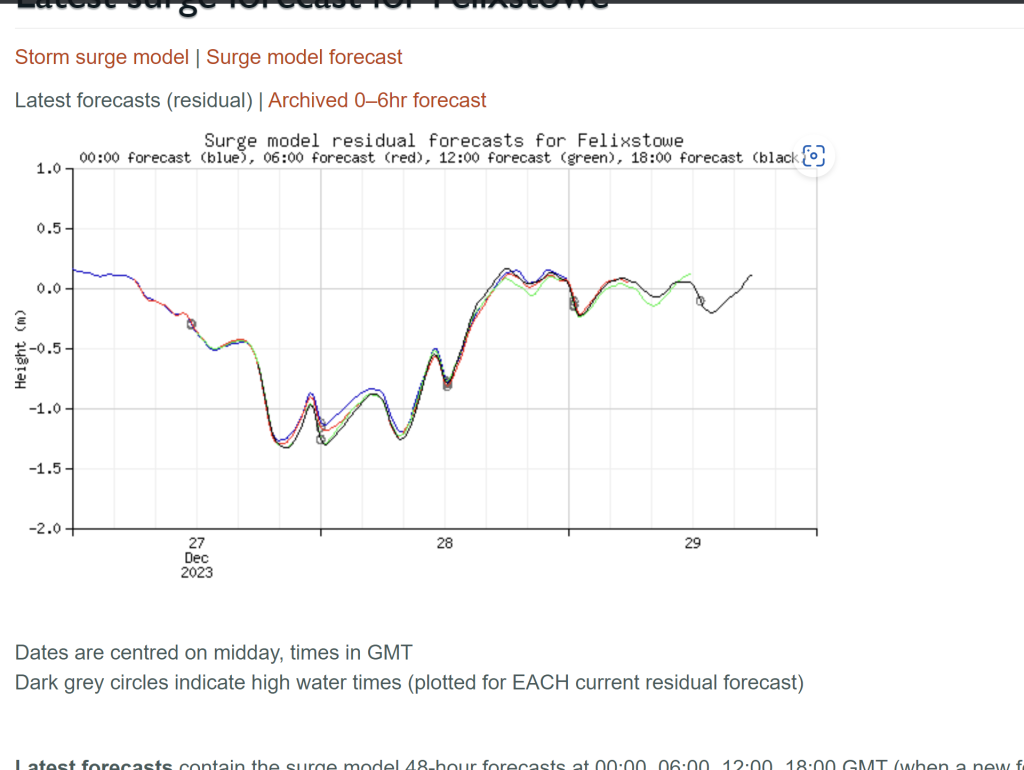
The largest local positive surge recently was 1.44m in 1995. Records for negative surges are still to be investigated: there was a negative surge of 1.7m at Harwich in 20196Surge model archive for Harwich – December 2019 | National Tidal and Sea Level Facility (ntslf.org) although this was near High Water. Surge forecasts for Felixstowe for 48 hours ahead are available.
A further set of negative surges occurred on the 27th and 28th of December, the sea was quite rough and the LW was in the darker hours.
The 1953 North Sea flood was caused by a storm surge7Surges see Skew surges | National Tidal and Sea Level Facility (ntslf.org) due to low pressure combined with a north-easterly gale, High Water and a Spring Tide. The surge element of 2m to 3m added to the tide raised the sea level by about 5.6m8Skew surge history: England – East | National Tidal and Sea Level Facility (ntslf.org). This event prompted, among other things, the installation of a national tide gauge network. On the anniversary of the flood in 1954, there was, apparently, a negative surge which almost drained the Orwell9Orwell negative surge see Frank Hussey, Old Fitz: Edward FitzGerald and East Coast Sailing, The Suffolk Library (Ipswich: Boydell Press, 1974) – the Harwich gauge data goes back to 1954 with negative surges up to around -0.5m but the data does not seem to support the claim..
Notes
Storms etc. see MARK BAILEY, PETER WAIN and DAVID SEAR. THE TRANSFORMATION OF THE SUFFOLK COAST c.1200 TO c.1600: FROM ORFORD NESS TO GOSEFORD. 2021.
and
Keeling, Charles D., and Timothy P. Whorf. ‘The 1,800-Year Oceanic Tidal Cycle: A Possible Cause of Rapid Climate Change’. Proceedings of the National Academy of Sciences 97, no. 8 (11 April 2000): 3814–19. https://doi.org/10.1073/pnas.070047197
Sources
Sea level data is available here Download processed UK Tide Gauge Network data from BODC
Here are surge forecasts for Felixstowe for 48 hours ahead.
Footnotes
- 1hPa the SI unit equivalent to the millibar, hecto=100, Pa = Pascal.
- 2
- 3A Pascal is equivalent to 1kg over 1m2 so there are about 10.13 tons – 1013mb/hPa=101,300Pascal=1013 hPa; 1 Pascal=1 Newton/m2/s2; 101,300/1000= 10.13 tons/m2
- 4More precisely, Sea level change -(change in pressure) / (waterdensity*g) where g=accelleration due to gravity
- 5
- 6
- 7
- 8Skew surge history: England – East | National Tidal and Sea Level Facility (ntslf.org)
- 9Orwell negative surge see Frank Hussey, Old Fitz: Edward FitzGerald and East Coast Sailing, The Suffolk Library (Ipswich: Boydell Press, 1974) – the Harwich gauge data goes back to 1954 with negative surges up to around -0.5m but the data does not seem to support the claim.
Image Sources and Credits
Image Credits and Sources
- Lowestoft-April-2014: ntslf.org/
- 1hPa the SI unit equivalent to the millibar, hecto=100, Pa = Pascal.
- 2
- 3A Pascal is equivalent to 1kg over 1m2 so there are about 10.13 tons – 1013mb/hPa=101,300Pascal=1013 hPa; 1 Pascal=1 Newton/m2/s2; 101,300/1000= 10.13 tons/m2
- 4More precisely, Sea level change -(change in pressure) / (waterdensity*g) where g=accelleration due to gravity
- 5
- 6
- 7
- 8Skew surge history: England – East | National Tidal and Sea Level Facility (ntslf.org)
- 9Orwell negative surge see Frank Hussey, Old Fitz: Edward FitzGerald and East Coast Sailing, The Suffolk Library (Ipswich: Boydell Press, 1974) – the Harwich gauge data goes back to 1954 with negative surges up to around -0.5m but the data does not seem to support the claim.
Image Credits and Sources
- Lowestoft-April-2014: ntslf.org/
