Commissioning 1942
H.M. Fort Sunk Head (U2) was the second Maunsell Navy Tower to be installed during World War Two in the Thames Estuary for Air Defence. After her commissioning at Tilbury, she was towed out on June 1st 1942: unlike The Maiden Voyage of Roughs Tower, the trip to the site was quick and uneventful. The site was deeper than Roughs Shoals and she was sunk, in the late evening1 The sinking took place at 2230 Double Summer Time which is 2130 BST, the tide had just turned and LW would have been about 0.4m., without incident, in 43′ (13m) of water, the maximum allowed. This made the main deck closer to the water than the other forts which must have been interesting in a storm: the deck would have been about 5m above MHWS. Action against the enemy was to follow within hours. Sunk Head was paired with Roughs (U1) and both were controlled by HMS Badger at Harwich.
Demolition 1967
Sunk Head (U2) was demolished in 1967 to deny it to radio pirates To misquote the Italian Job, made two years later:
“You’re only supposed to blow the bloody doors off!”.
Probably the Navy was also having some fun. This short video shows the event. The stumps of the towers were left standing above sea level. This resulted in a vessel being damaged by colliding with them in 1991. Presumably, the job was finished not long after this.
What remains in 2023?
Admiralty Charts show, two cables south-west of the Sunk Head Tower Cardinal buoy, an obstacle marked at 2.3m below Chart Datum (CD). As the seabed is at 13m it seemed reasonable that this was the remains of the Sunk Head Maunsell Sea Fort. At LW Springs, or in a rough sea, this could be a hazard to unlucky deep-keeled yachts.
Curiosity led first to checking available bathymetry data2Bathymetry – ‘1992 HI549 Long Sand Head and Black Deep’ which had soundings about 50m apart and showed nothing of the remains. So, could the remains be detected on a yacht depth sounder? This inspired a trip to the site on July 20th 2023, a calm day. No wind meant motoring to the site, on the other hand, sufficient wind for a reasonable passage would have made the sea rougher and surveying less successful. The afternoon sea breeze, however, made for a relaxed return trip under the chute.
SONAR Survey
With a standard yacht depth sounder expectations were not high: a data feed from the boat’s instruments recorded the requisite data of time, latitude, longitude, heading and depth below the transducer. The system was capable of recording a reading only every two seconds. At four knots this gave a distance between readings of 2m, this may be improved for the future: motoring into the tide helps to slow the boat and decrease the spacing. The calm sea state, and need to motor, was a boon as the yacht remained upright: a heeling angle of only 5° would produce a position error of over a metre on the seabed. In retrospect, we did turn the yacht quite rapidly and this probably introduced errors.
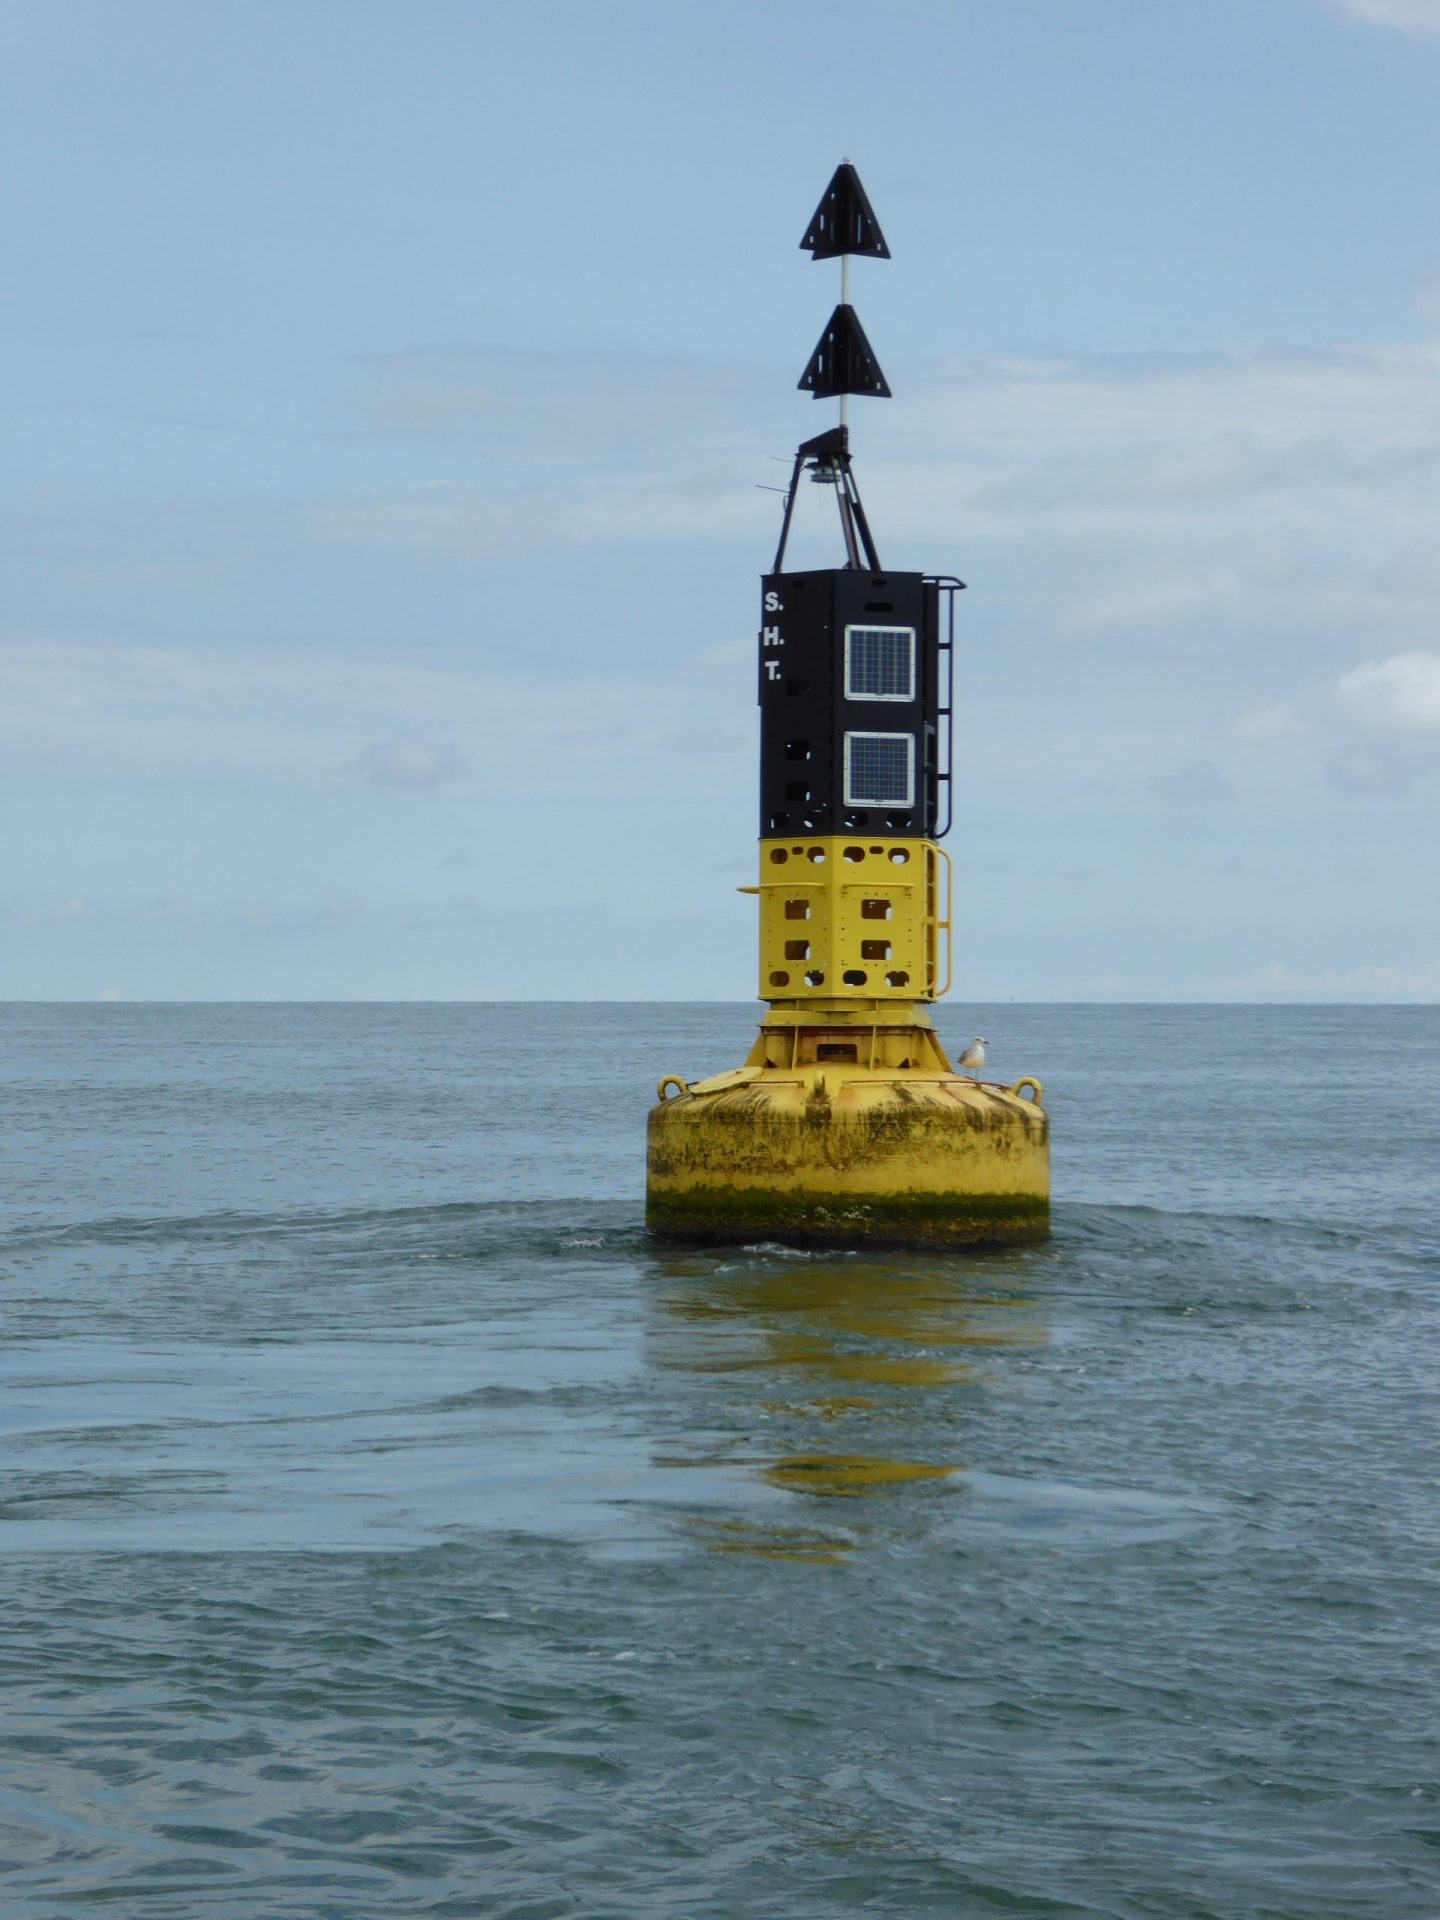
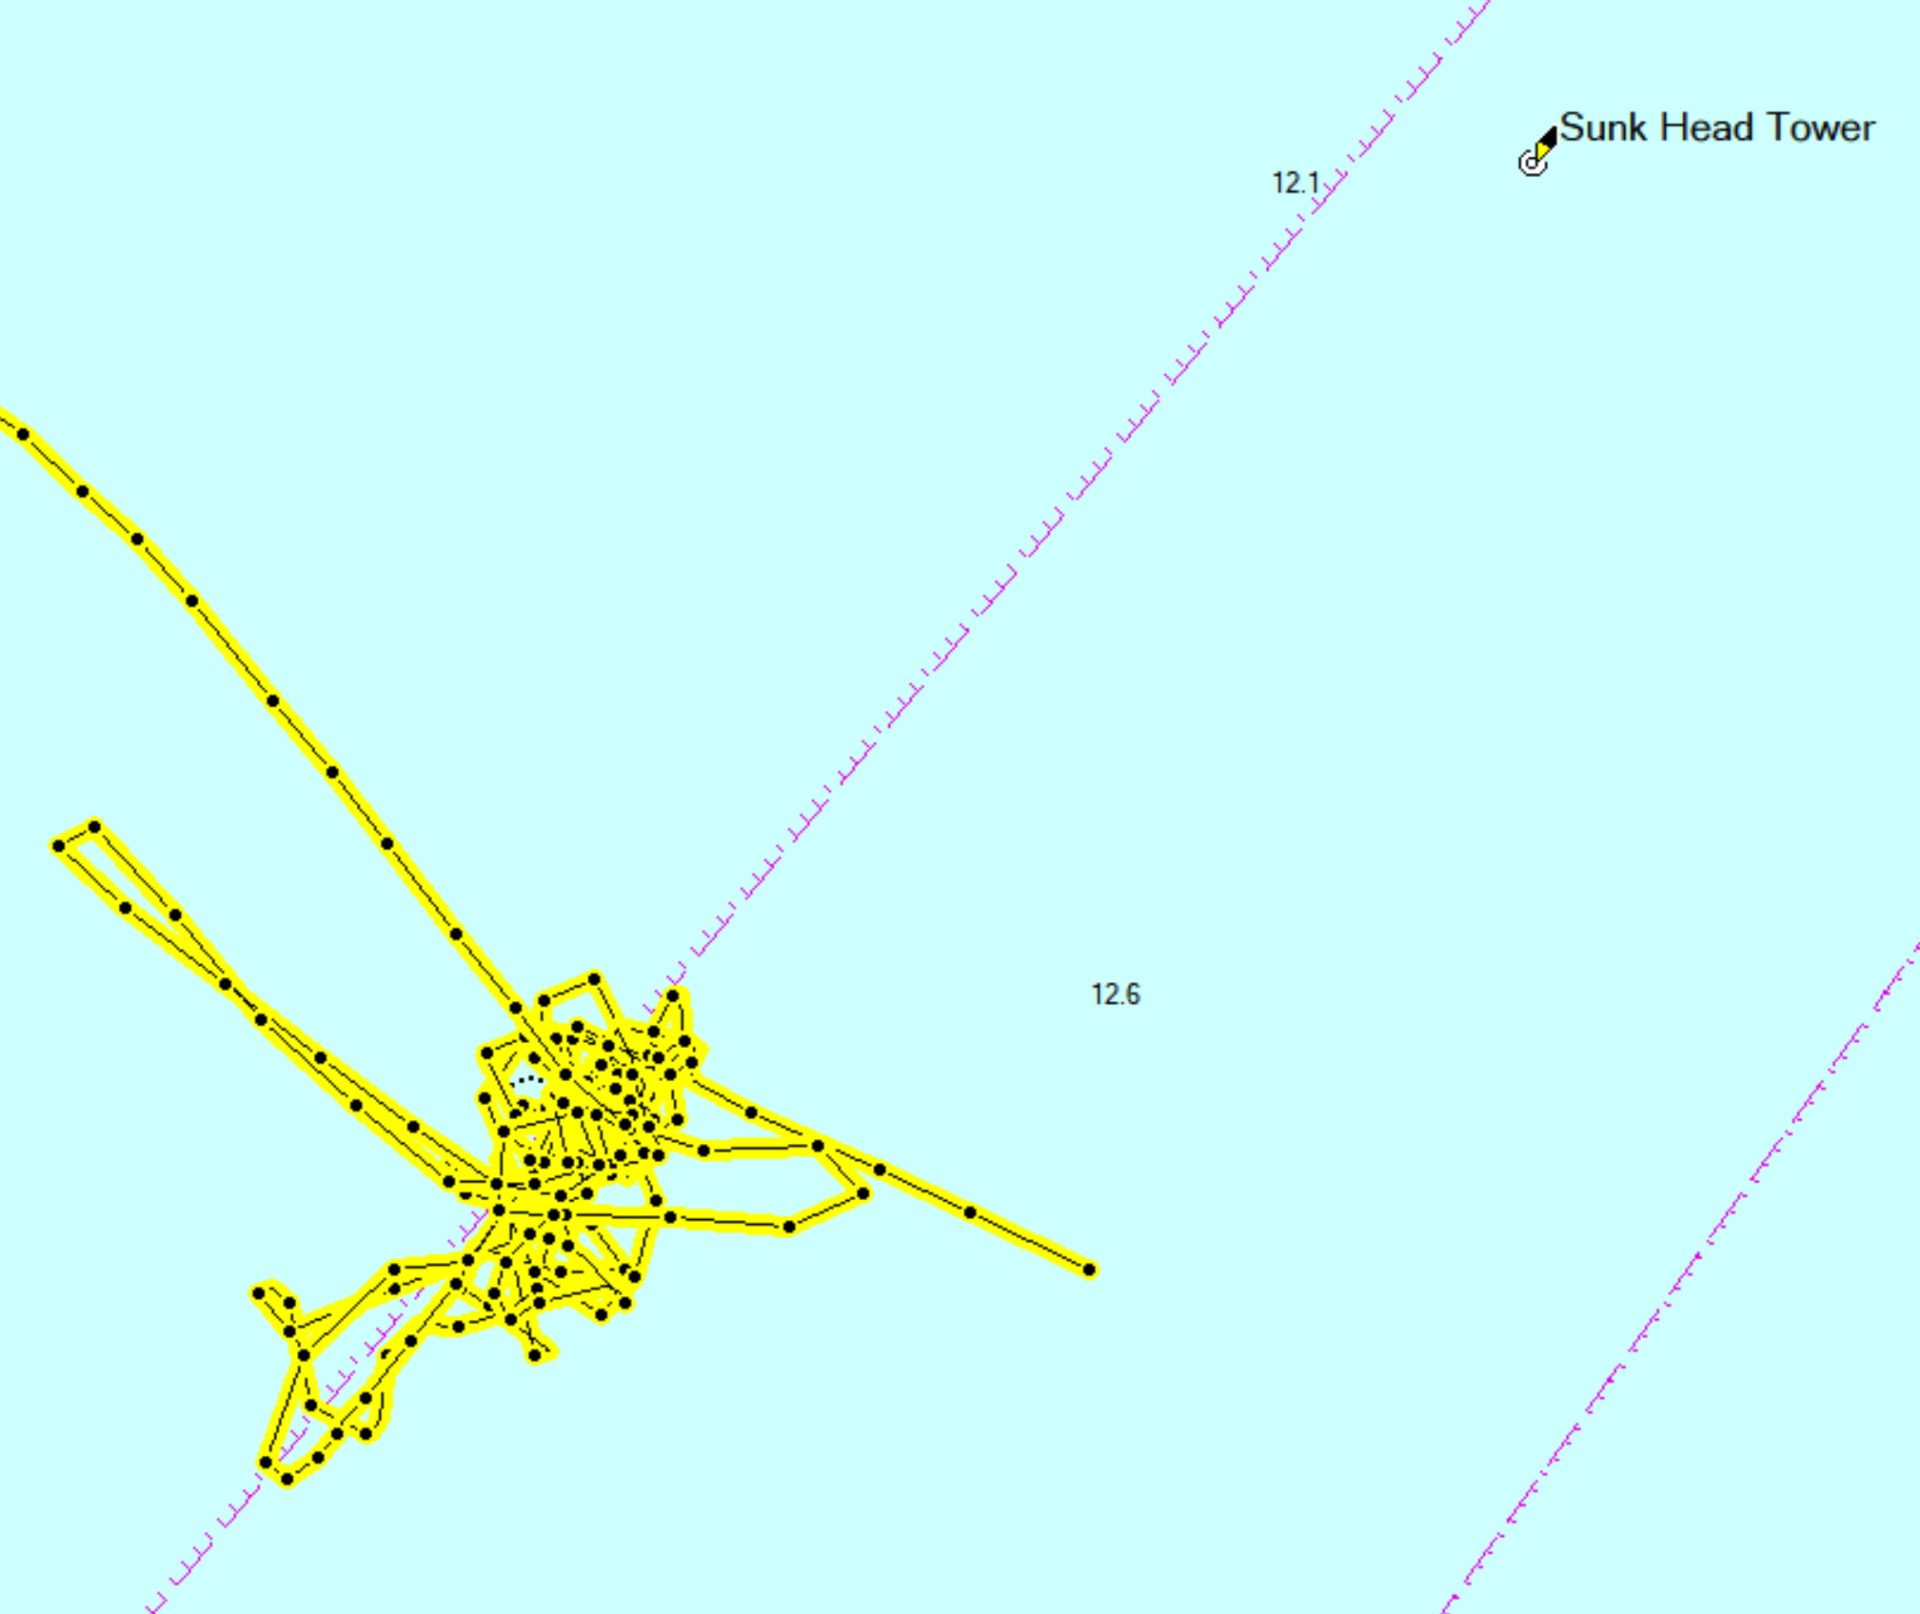
Once on site, the SHT North Cardinal provided a convenient visual marker at only two cables to the northeast of the site: stupidly it was neglected. This part of the exercise had not been thought out, other than a vague plan to use the search pattern function on the autohelm which was not successful: lesson: “If you haven’t tested it, it doesn’t work”3“If you haven’t tested it, it doesn’t work”- U.S. General Swarzkopf. Attempts to conduct a coherent search pattern using the GPS plotter display in a three-knot tide were less than graceful as the track shows.
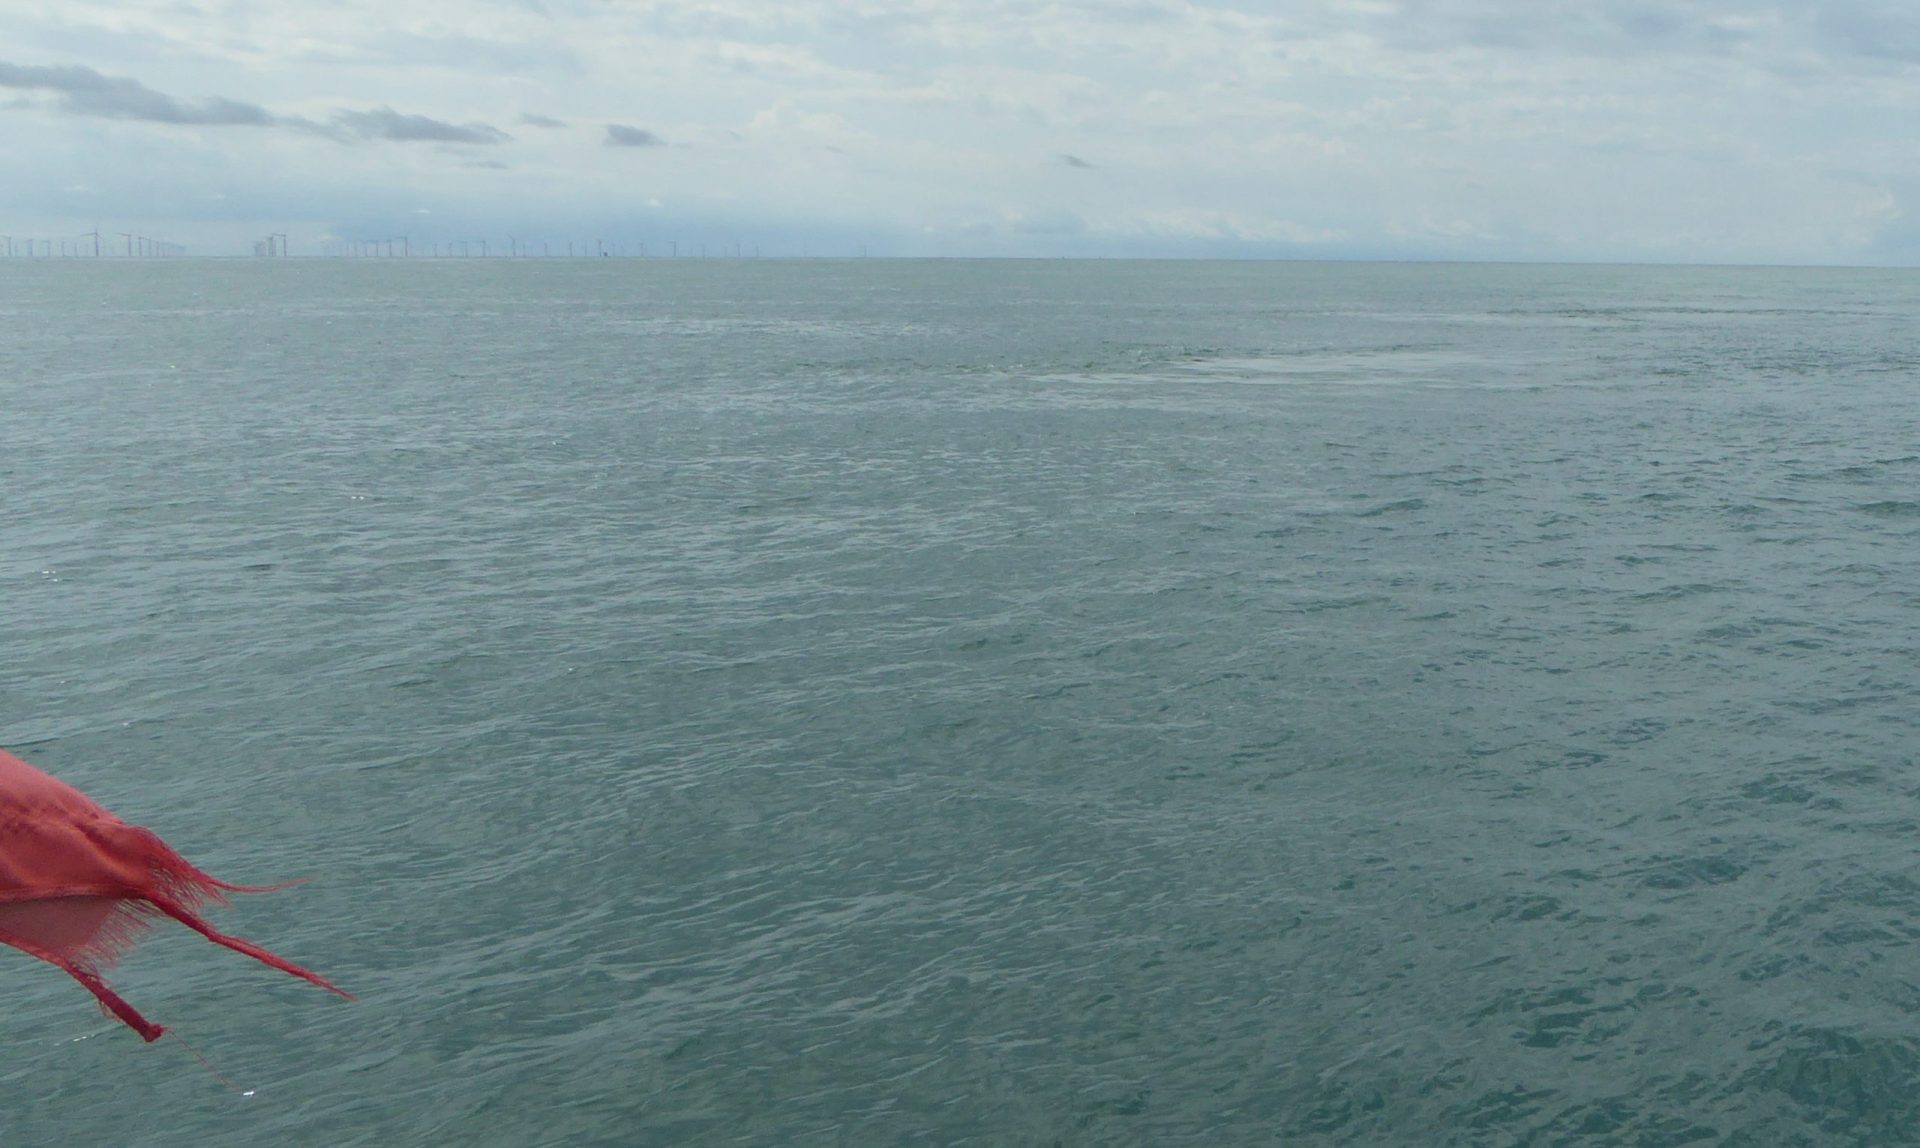
Trying to carry out a structured sweep using the plotter display, with its slight delay, was not straightforward. But, despite this, we very quickly detected a change from 14m to 6m on the sounder. After this we, not very systematically, covered the area as best as we could. Interestingly, one of our team noticed that there was an area of disturbance that was obviously downtide of the remains. This would be visible in calm conditions.
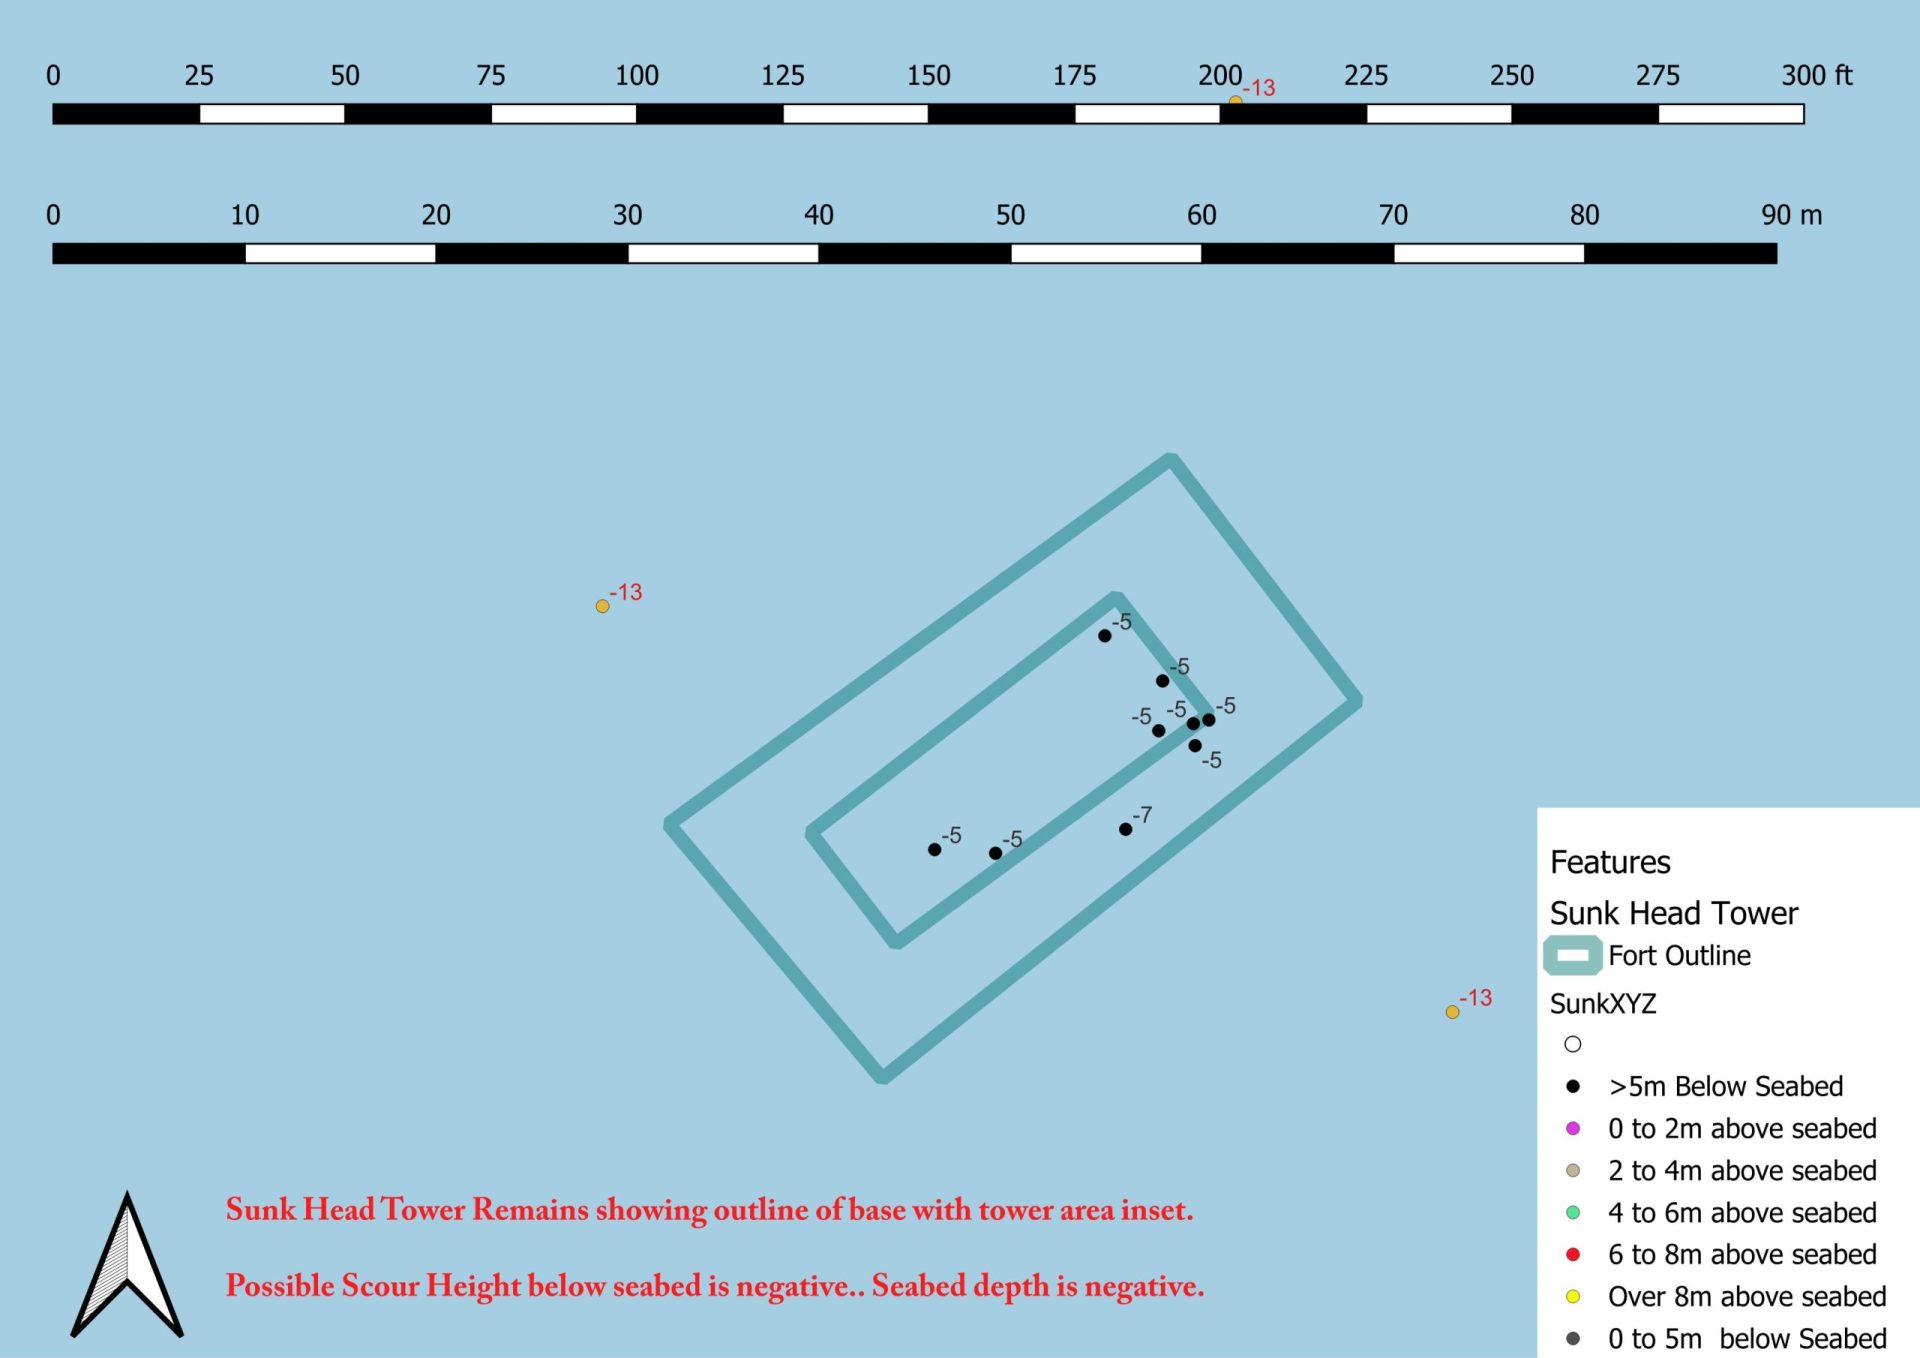
Another observation was that there was an area where the depth was greater than the general seabed: this was probably a tidal scour.
Having returned safely with the data the ambition was to create a 3D model of the soundings to assess if we had detected the fort’s remains. The technical details are in the pullout section below.
Technical Details on processing the data
An Excel spreadsheet was used to process the data: there were complications to be resolved:
- For safety and best use tide, the trip had been made when HW Harwich was 1420 BST. At the time of the survey, around 1238 to 1258 BST, the Harwich Approach gauge, 12M due North, read 3.04m, allowing a reduction to be made to CD. This process was verified by the fact that the minimum reduced depth observed was 2.56m which only 0.26m different to the, possibly overstated 2.3m depth of the obstruction.
- The logged depth from the sounder was from the transducer on the keel, so a correction had to be added to achieve sea level. To make the data more useful the depth was then corrected to CD by subtraction of the actual tidal height at the nearest real-time gauge. This was the Harwich Approach station, only about five minutes different on the co-tidal chart. Doing this meant that the data could be checked against charts and historic bathymetry.
- The depth of the local seabed was estimated by inspection of the chart and of publicly available bathymetry of the ‘1992 HI549 Long Sand Head and Black Deep’ which verified that the reduction and estimate of seabed depth were within 0.5m. Probably, the tide was higher 12M south of the gauge. See Elevation and Depth Data for more.
- The GPS antenna is at the stern and offset 1.5m to port and the depth transducer is 6m forward of the antenna on the centreline. Whilst this sounds insignificant, when the boat changes direction: two readings taken over the same point from opposing headings would be recorded as over 12m apart. Some calculations revealed that to correct the reading then the Latitude, Longitude should be transposed by 6.18m in the direction of the heading plus 14°.
- These data were extended to include displacement in metres north(Y) and east(X) from the southwest corner of the selected area: this would be needed to produce a 3D view. The other addition was to convert the depth to height (Z) above the seabed, the scour would appear as negative since the image would need to be relative to this and not sea level. When converting degrees Lat/Lon to distance it has to be remembered that Longitude degrees are reduced in length as Latitude increases.
- The tidal flow is, on average, 230° flood and 050° ebb. This can be used to convert the views in the Latitude(Y) and Longitude (X) vertical planes into views along the long axis and beam axis of the fort.
This resulted in having about 1000 data points for the selected area, Date, Time, Lat, Lon, X metres, Y metres, Heading, Depth and Height above the seabed. Plotted onto 0.5mx0.5m squares only 3% of squares were captured although this is probably too ambitious a measure.
The next step was to plot this data in the eastwards and northwards vertical planes and, ideally, produce a 3D view. This proved harder than expected. Various tools were tried including Excel; Excel add-ons, QGIS; Google Earth: Charts3D, Origin and Rinean. The results from a selection of these are shown in the main text.
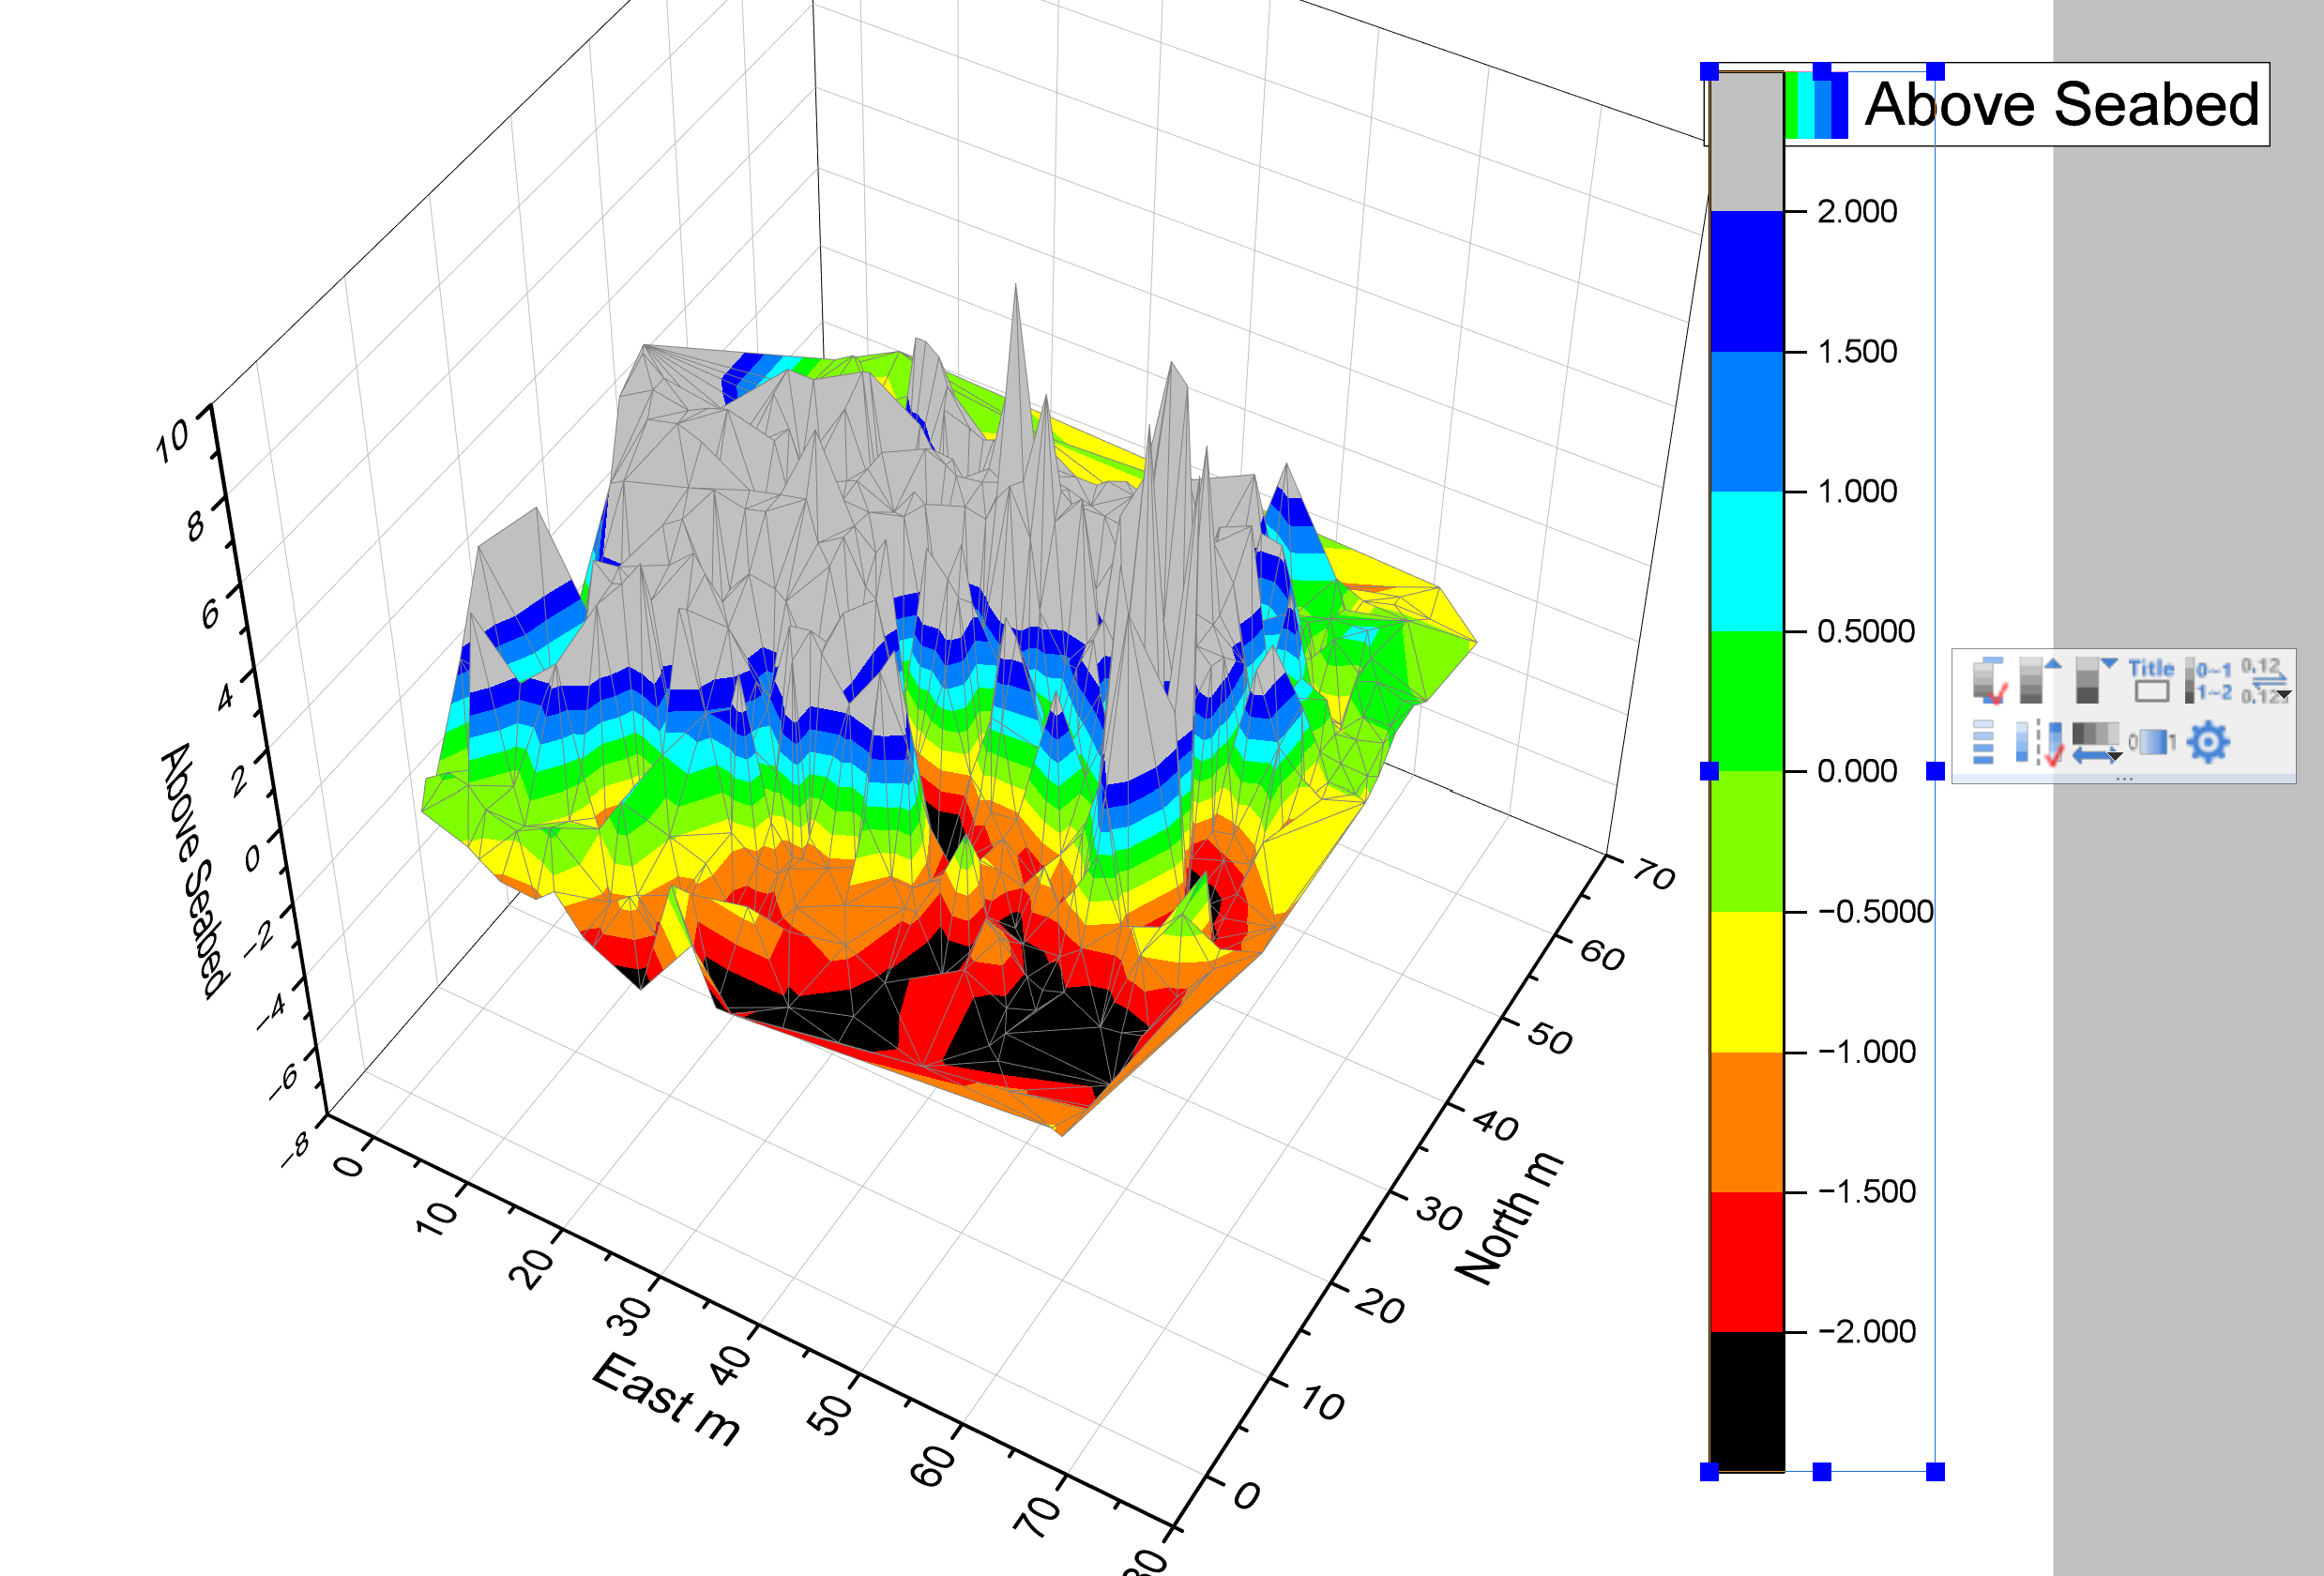
Plotting the desired 3d Surface in QGIS proved too difficult: eventually, Excel was used to produce an XY MESH (values rounded to 0.5m) of the Z values, which fed into Rinean which gave an acceptable result. A trial version on Origin produced a surface plot but, due to the sparse data, the result was not good, although it did show the scour. Next time rounding to the nearest metre should be adequate.
For background, the fort sits on a hollow concrete base 14′ high (it was built in feet so roughly, divide by three for metres), 88′ wide and 166′ long. The rough model shows the arrangement of the base and towers as the structure settled on the seabed (deeper in the case of Sunk):
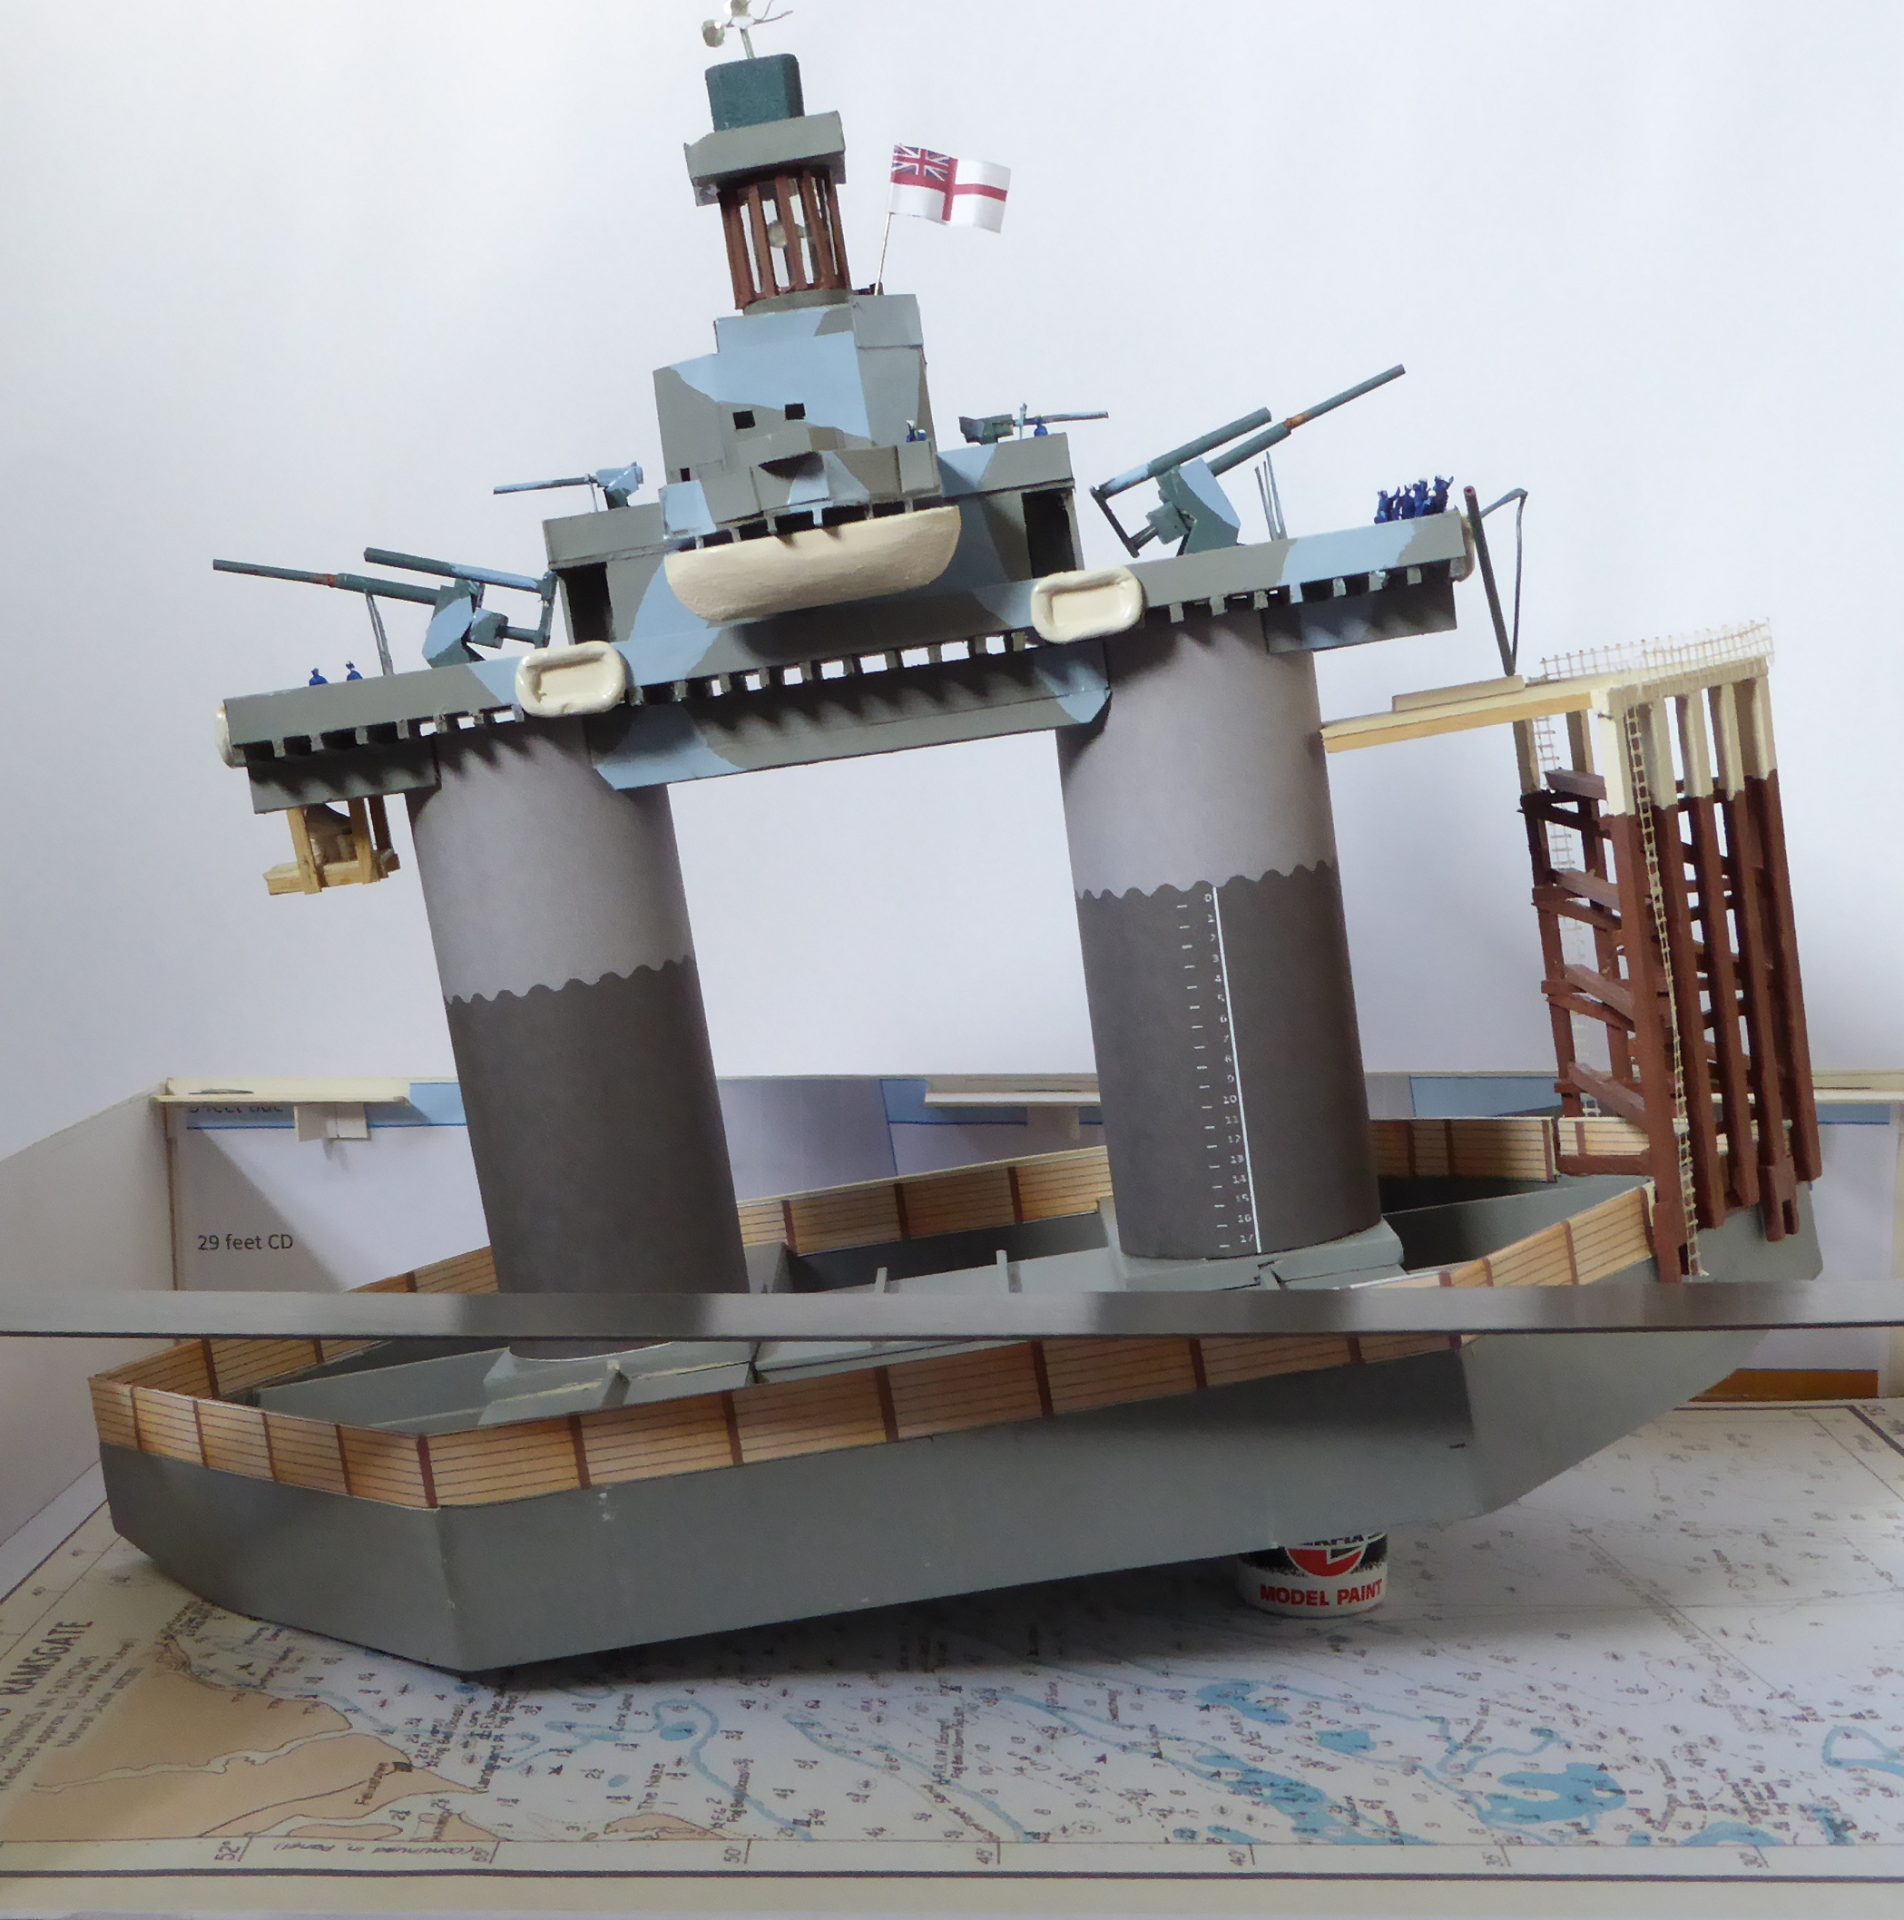
The base may have sunk slightly into the seabed but should stand well proud. The two towers are centrally located along the long axis and are 24′ in diameter, and 36′ apart: therefore, this upper section should be 84′ long and 24′ wide. The long axis should lay along the line of the tidal flow, note that this is convenient for surveying. Those with an interest in tides might note that each of the Maunsell Navy Towers has its own Tidal Diamond. A look at the tower demolition video shows that there was a considerable superstructure and, one would expect, large portions of this to have fallen on, or very near to, the base. As there is a photo of the stumps remaining above sea level then there was probably a second round of demolition charges to reduce them to their current height. The tidal scour would be expected to be along the tidal line and in line with the long axis.
3D Diagram
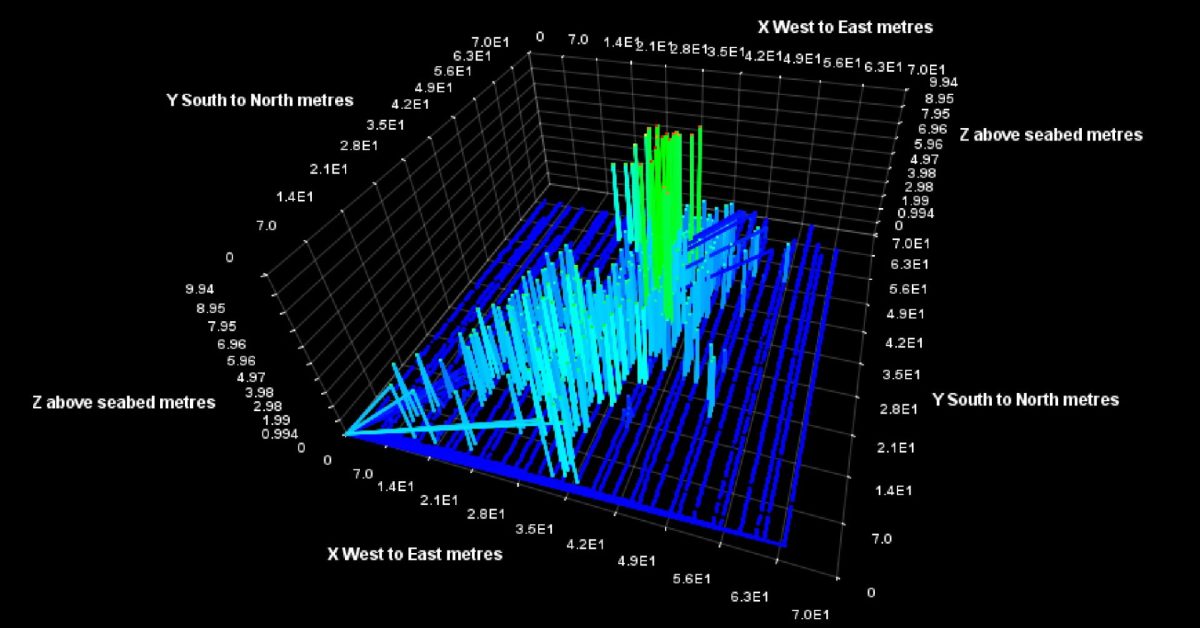
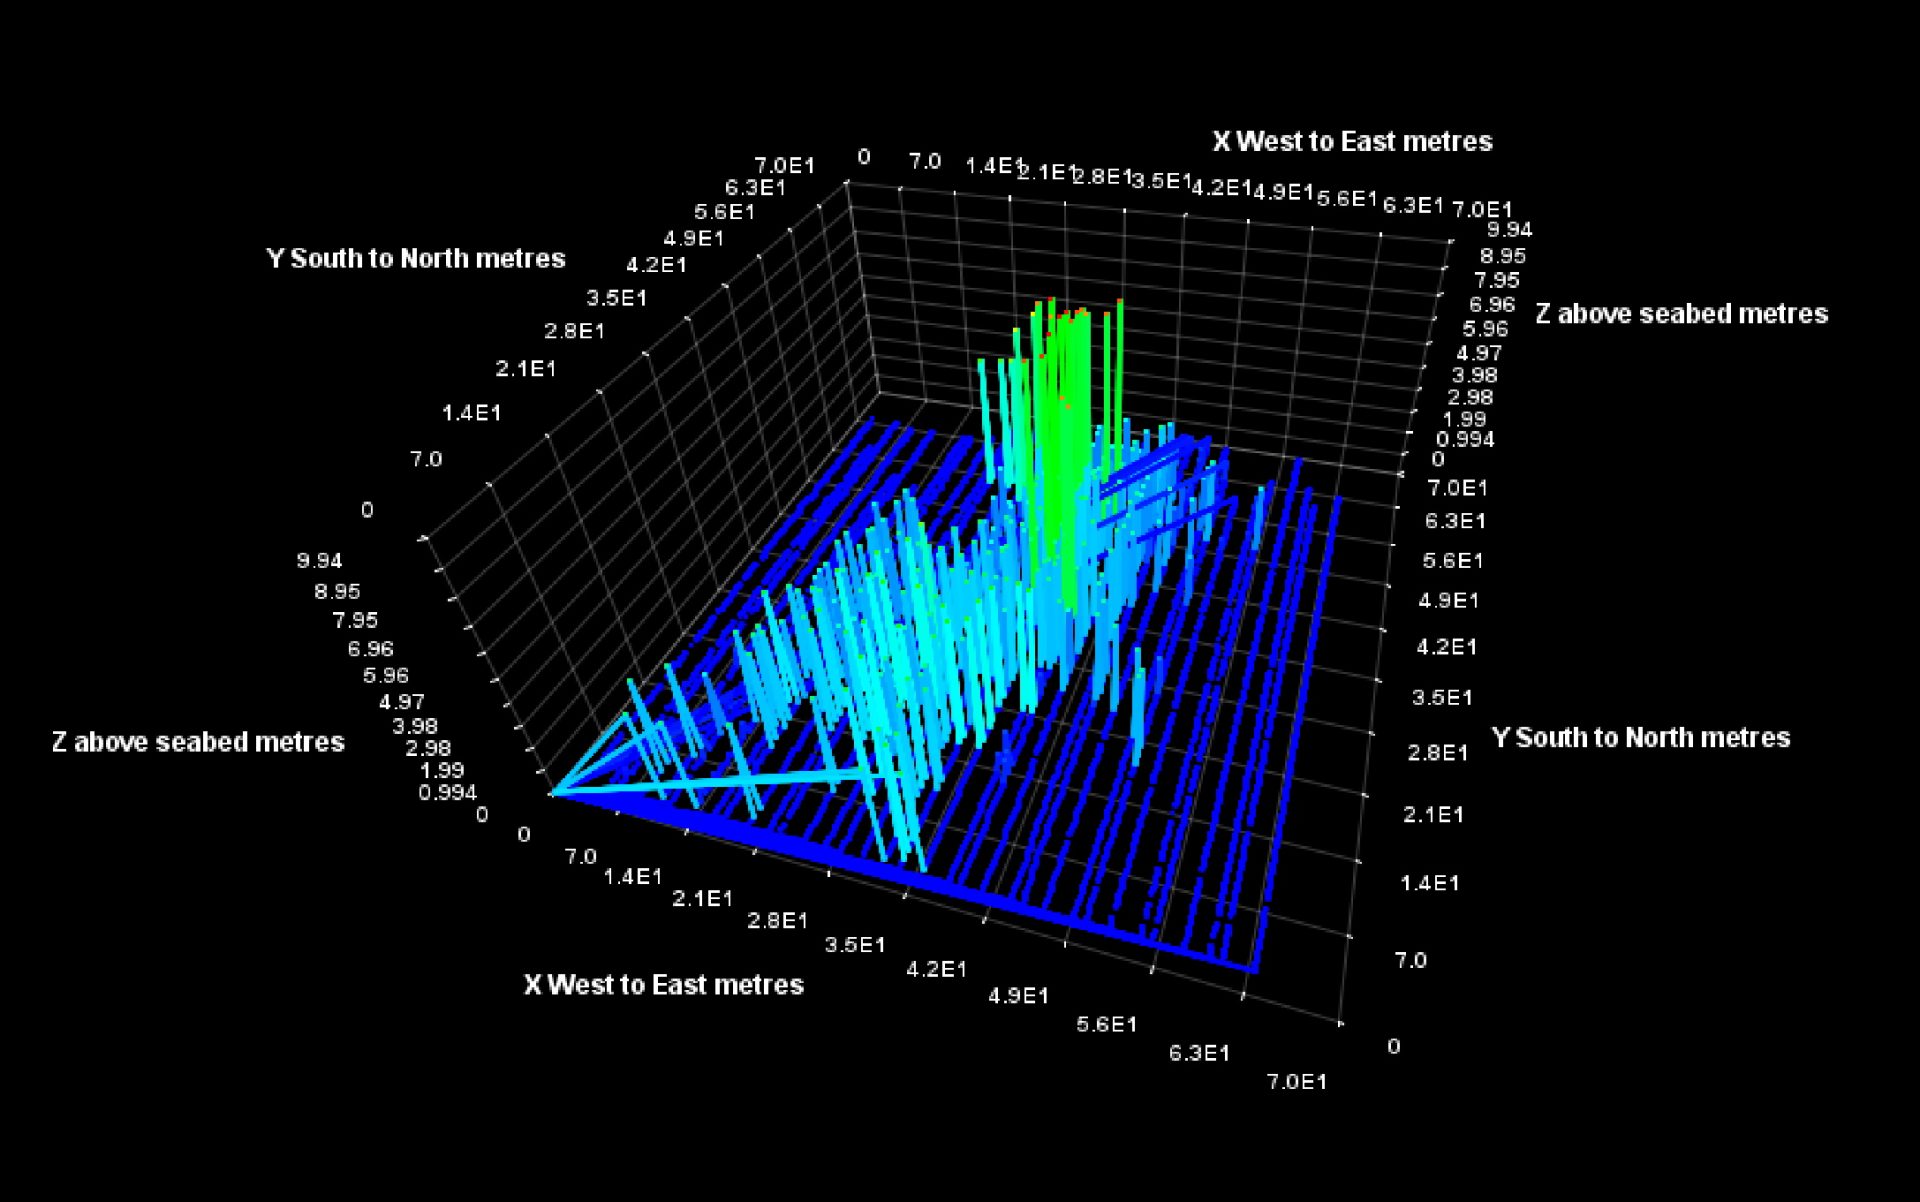
A 3D diagram of the soundings above the seabed was produced which gives an impression of the base with the jagged tower stumps above it reaching within 2.3m of Chart Datum sea level. As only 3% of the available 0.5mx0.5m squares were captured the result is crude but the base (in light blue) stands out above the seabed (dark blue), as do the tower stumps (light green). The vertical scale has been exaggerated, the scour has been omitted. The alignment of the structure in the diagram agrees with the tidal flow direction.
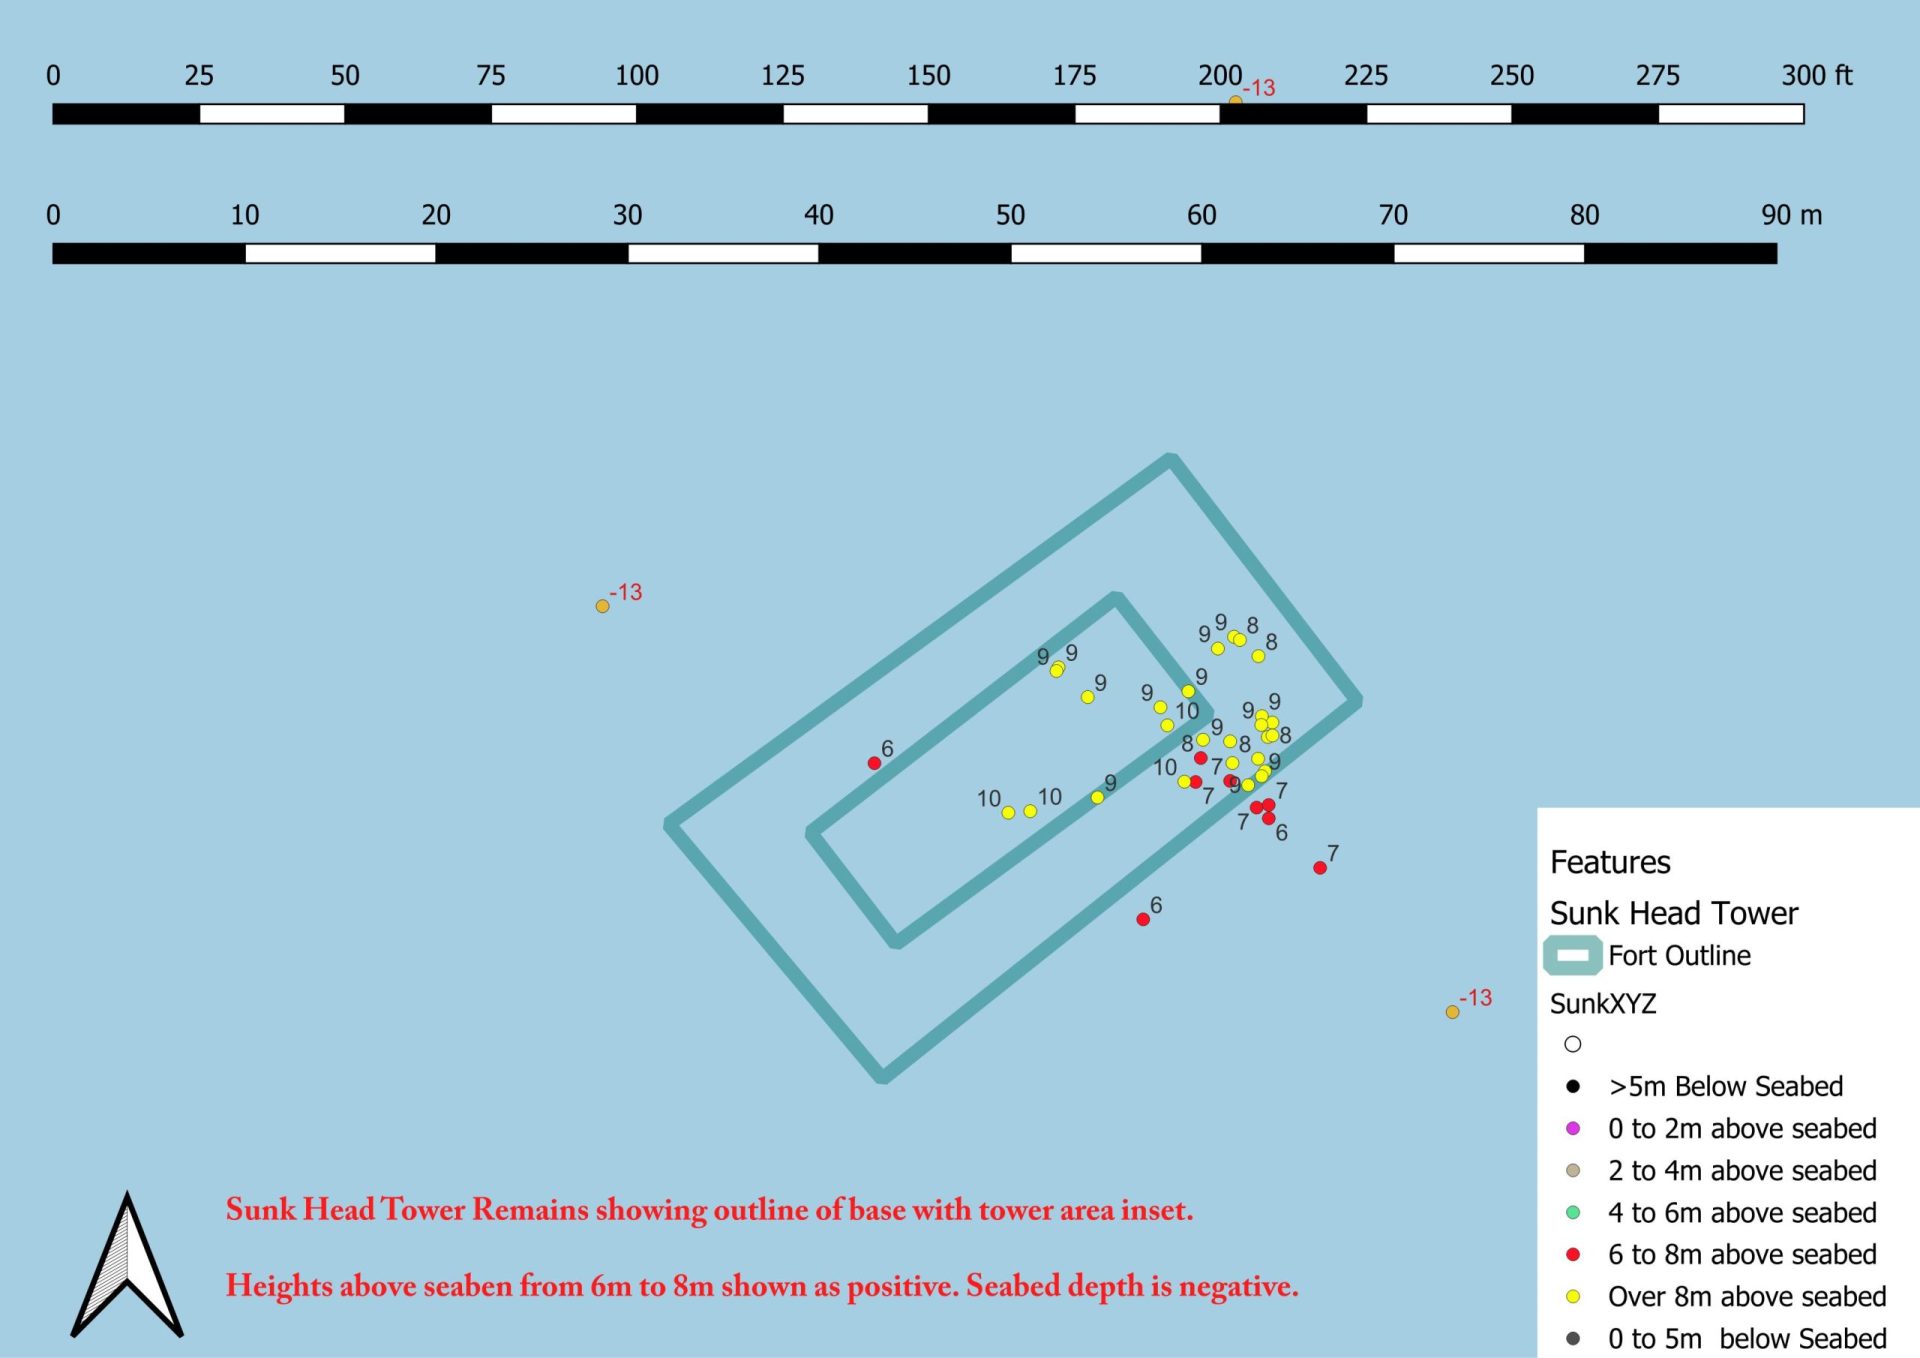
The heights above the seabed were also plotted (on QGIS mapping software) and rectangles of the same dimensions as the base footprint and of the two towers were superimposed. The view of 2m to 4m heights reveals an object, perhaps 160′ to 200′ long, between the seabed and about 4.5m above it, this is consistent with the base.
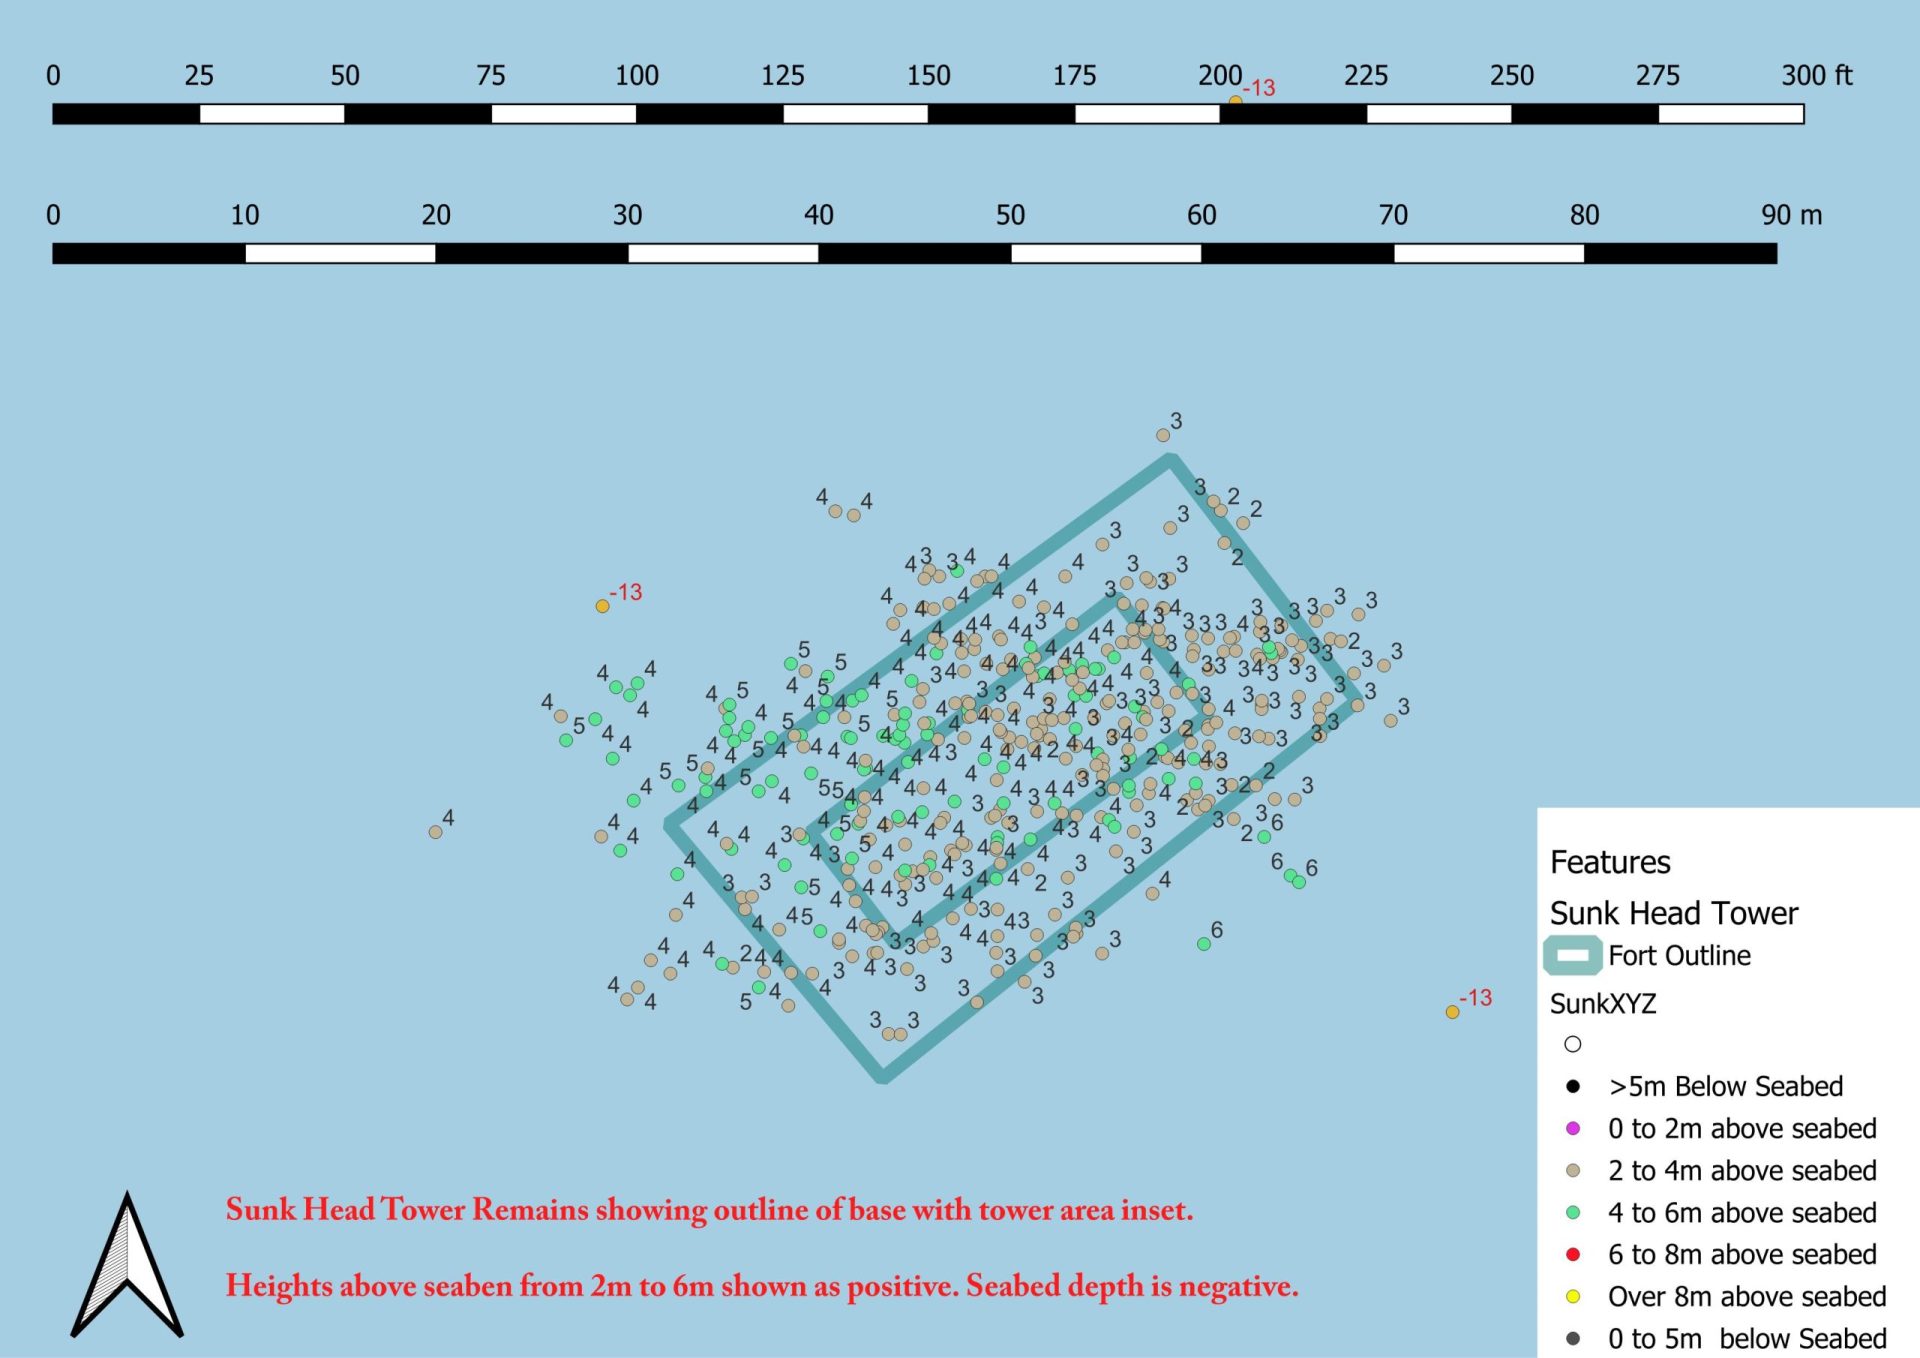
Next, in the view of 6m to 8m above the seabed there is something narrower, perhaps up to 30′-40′ wide, this is, presumably, the stumps of the towers which, at least in parts, extend to within 2.56m of Chart Datum from the soundings compared to 2.3m from the chart – an error either in reduction or the chart.
There is a deeper section, possibly a scour, from 5m to 7m below the seabed. This appears to coexist with the base, which is not easy to explain. Perhaps this is due to poor spatial resolution, in any case, one would expect the scour to be in line with the tide.
Summary of results
The results show that there is definitely a structure present that resembles the likely remains of the tower and is about the size expected. However, the soundings are few and of inadequate quality to produce a definitive view.
- The soundings at 2m-4m above the seabed roughly fit the footprint of the base, 166′ by 88′.
- The plan view at 8m above the seabed is a close fit to the dimensions of the two towers, it may be that the diagram could be better fitted to the data points.
Interpreting the shape from such sparse data is problematic, given that there is likely to be large sections of superstructure debris and probably a reasonable collection of old fishing gear attached to it. However, the results do look like the remains of the Sunk Head Tower. Hopefully, a better survey with improved techniques will be made in the future. The exercise showed what fun can be had with yacht electronics on a lovely day. The data can be made available on request.
Thoughts on the next attempt
- Best near HW Springs.
- A calm day is needed.
- Use the turbulence to find the site.
- Using the cardinal as a visual reference, perhaps guided by a hand bearing compass, is probably a good method.
- There is an advantage in steering into the tide since this reduces the distance between soundings as the speed over the ground is slower: rudder control is also enhanced and, on the flood, one is facing the cardinal.
- Turn slowly.
- Use the co-tidal data in the tidal atlas to improve reduction, although there is only a 5-10 minutes difference.
- Buy a Multi-Beam or Sidescan SONAR set for the yacht!
Notes
The demolition used used ‘Hayrick’ charges. More on these below:
Sources
Footnotes
- 1The sinking took place at 2230 Double Summer Time which is 2130 BST, the tide had just turned and LW would have been about 0.4m.
- 2Bathymetry – ‘1992 HI549 Long Sand Head and Black Deep’
- 3“If you haven’t tested it, it doesn’t work”- U.S. General Swarzkopf
Image Sources and Credits
- 1The sinking took place at 2230 Double Summer Time which is 2130 BST, the tide had just turned and LW would have been about 0.4m.
- 2Bathymetry – ‘1992 HI549 Long Sand Head and Black Deep’
- 3“If you haven’t tested it, it doesn’t work”- U.S. General Swarzkopf
