See also Waldringfield’s Mystery Cuttings
Objective
To establish the level of clay below the marsh to assess the importance of clay accessibility to sea wall construction.
SSSI
The site has an SSSI sign, it is not shown as such on the Government SSSI map1Search for Land Based Designations / Site of Special Scientific Interest. The only one shown in the area is Waldringfield Pit on the BT site.. Probably some check should be made on ownership & permission before any publication.
Method
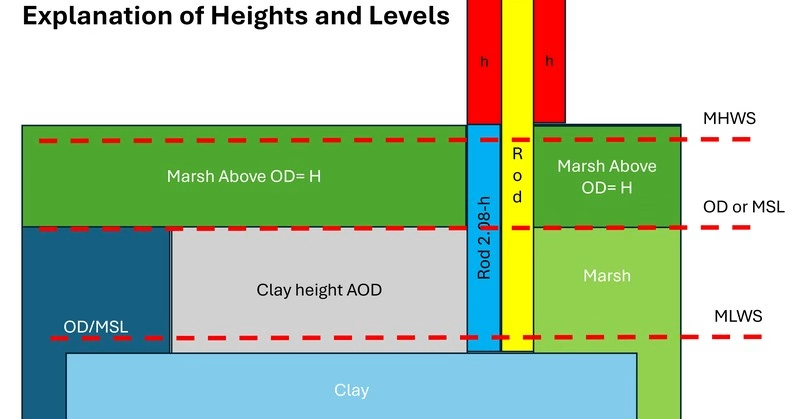
A series of probes into the marsh were made with a 2.08m long 8mm diameter fibreglass rod. The clay layer could be detected by much increased resistance after which the height of the rod above the marsh (h) was recorded with an associated GPS waypoint. Several lines of points were made. The data is in the spreadsheet below.
The elevation AOD of the marsh at each waypoint above OD was found from
- Marsh spot heights from 0.25m LiDAR (= ‘H’).
- Clay level below marsh surface= (2.08-h)m
- So, the Elevation of clay above OD is H-(2.08-h)m
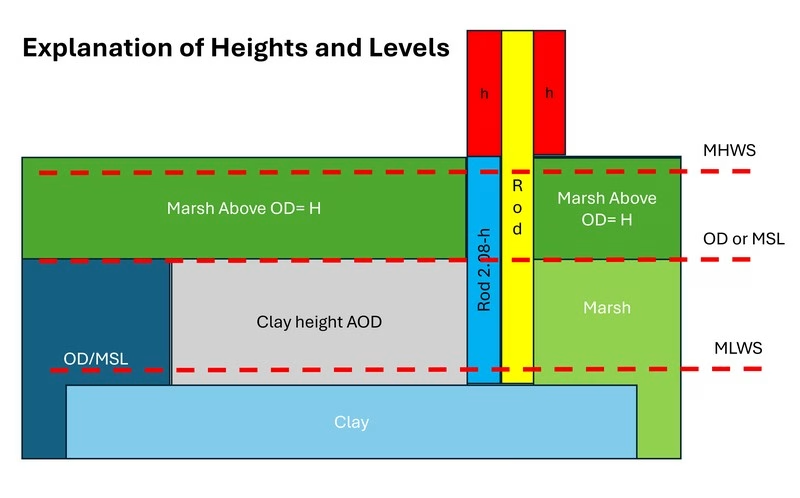
The length of the rod limited the bore depth, consequently, the clay level is only known as a minimum value for those bores where the rod was inserted to its full length. These need to be repeated with a longer rod. The values have been retained but marked on the diagram.
Analysis
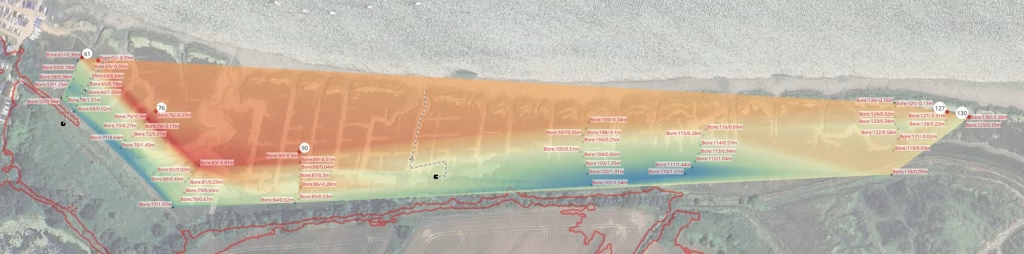
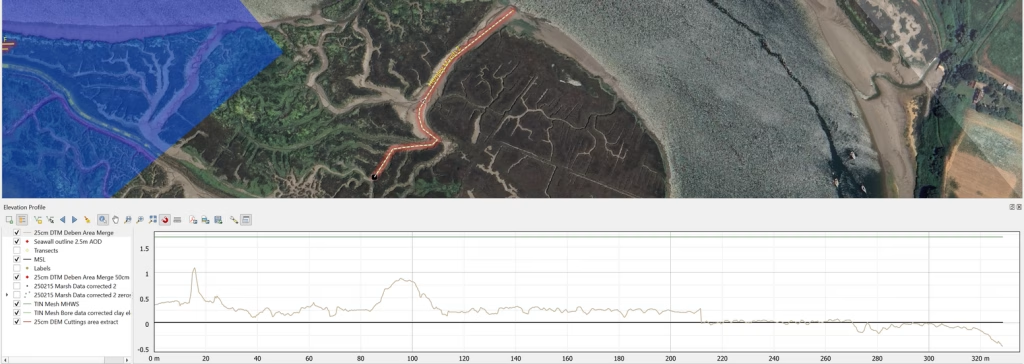
The borehole readings were converted into Clay Elevation AOD (usually a -ve value) for each point. Next, a TIN mesh was created in QGIS to represent these values as a surface (note caution on some readings above). A QGIS map was created of the area featuring:
- The 2.5m land contour representing the seawall.
- The 0.25m resolution LIDAR scan of the area as a DEM.
- The Clay Level AOD.
- Lines representing MSL and MHWS.
The overview shows the bore data with shading for clay elevation, blue shallower, and red deeper.
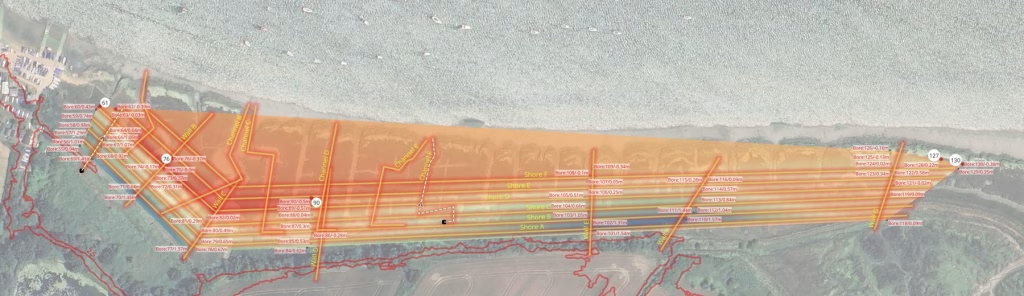
A series of transects were made along and perpendicular to the shoreline as well as in a few channels. Profiles were then produced with the QGIS profile tool for each transect showing the seawall, sea levels, marsh surface and clay level.
Sea Levels
MSL Woodbridge is 1.98m, Woodbridge Haven is 1.90m so take Waldringfield to be 1.95m. See Data Here. CD is AOD-MSL. Interpolating for Waldringfield:
- MHWS=3.9m, MLWS=0.5m
- MHWN=3.0m, MLWN=1.0m
- So sea level is +/- [3.9-0.5m ]=+/-1.7m above and below OD/MSL at Mean Springs, +/1.0m above and below OD/MSL at Mean Neaps.
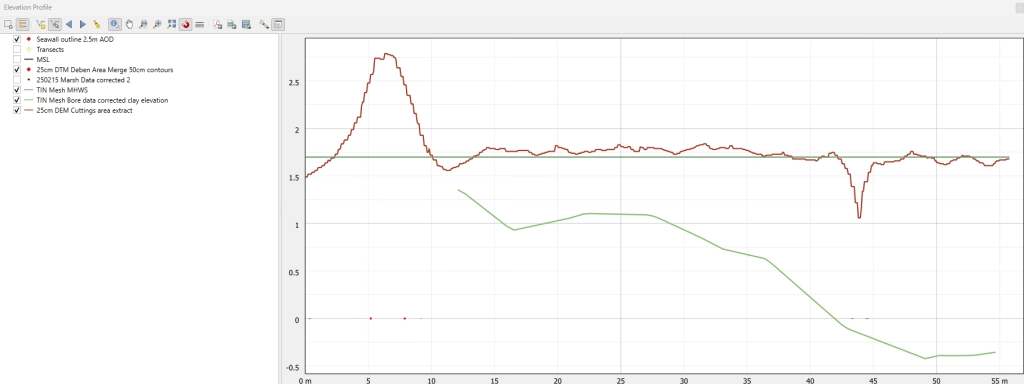
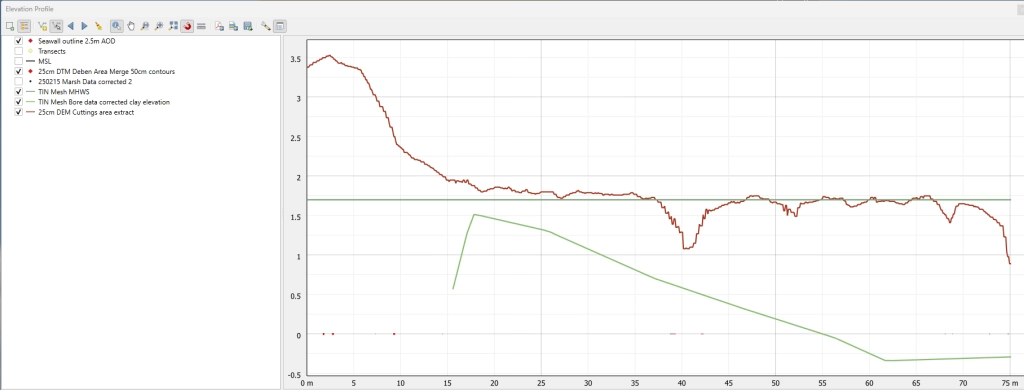
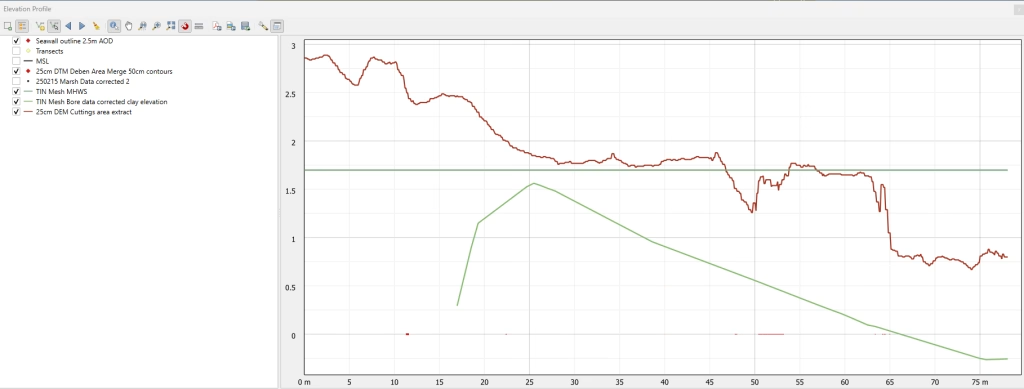
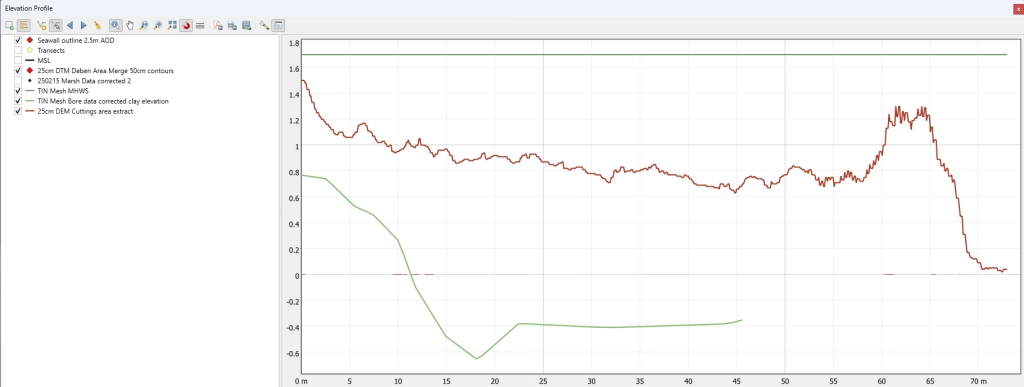
Elevations – Walls
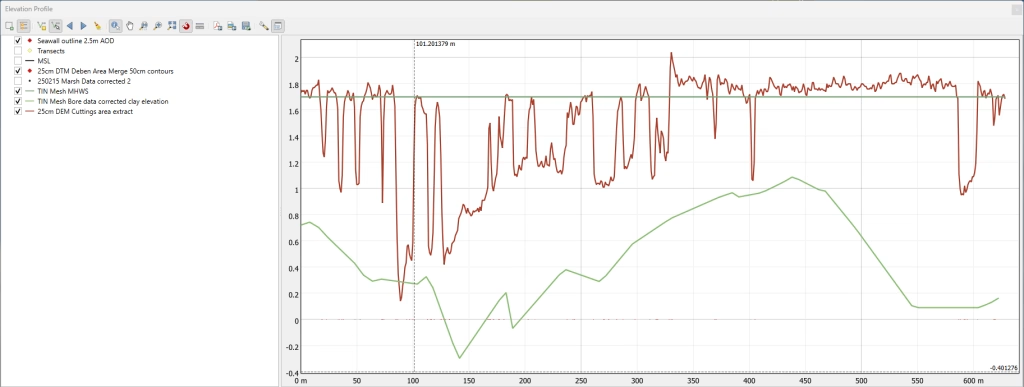
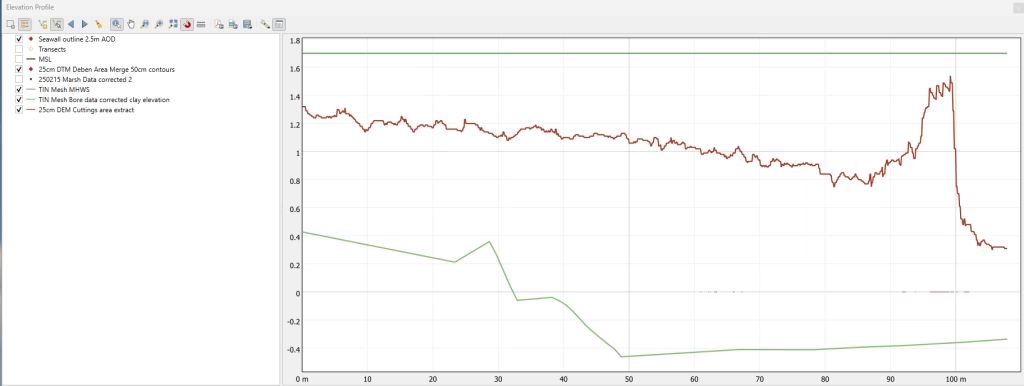
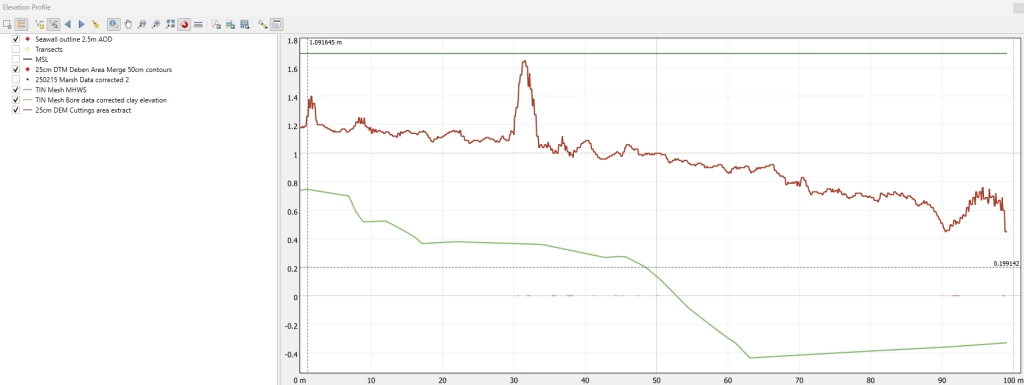
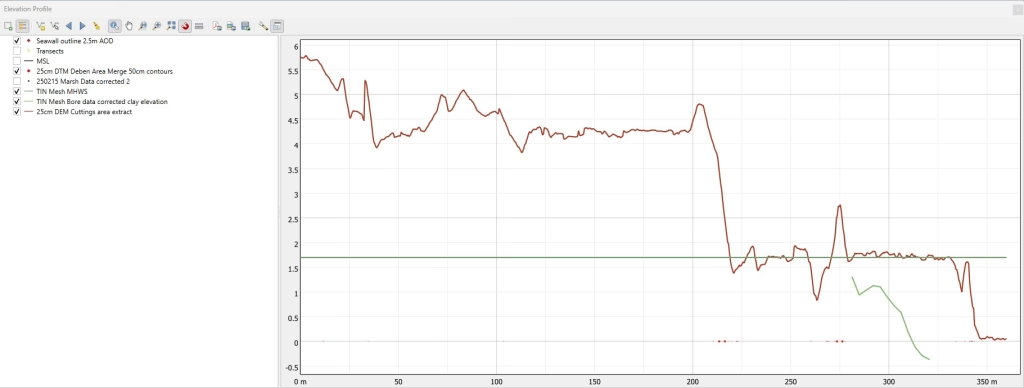
These run left to right from the seawall to the river. The red line is the level of the marsh surface above OD. The straight line is MHWS and the green line is the level of the clay surface.
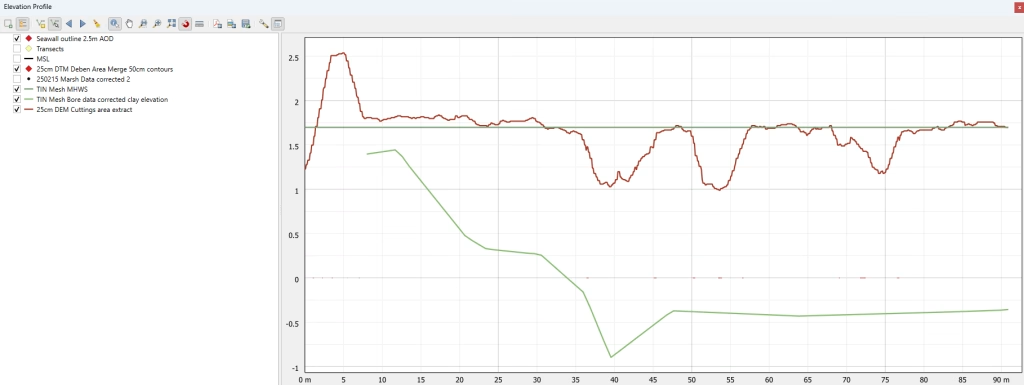
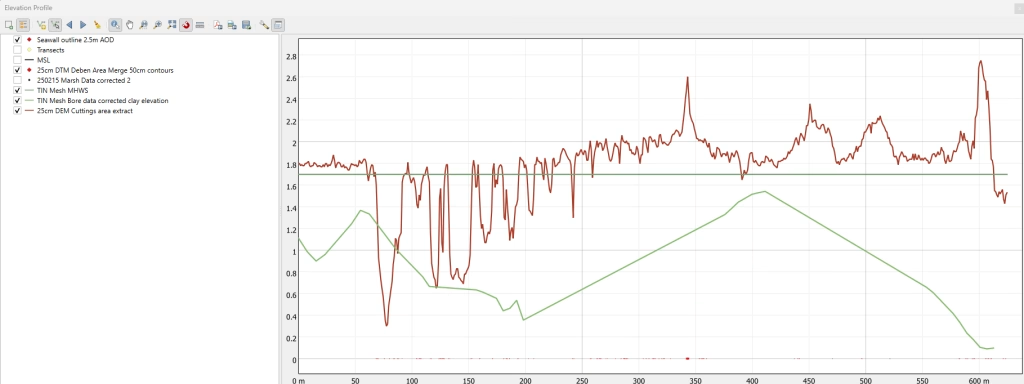
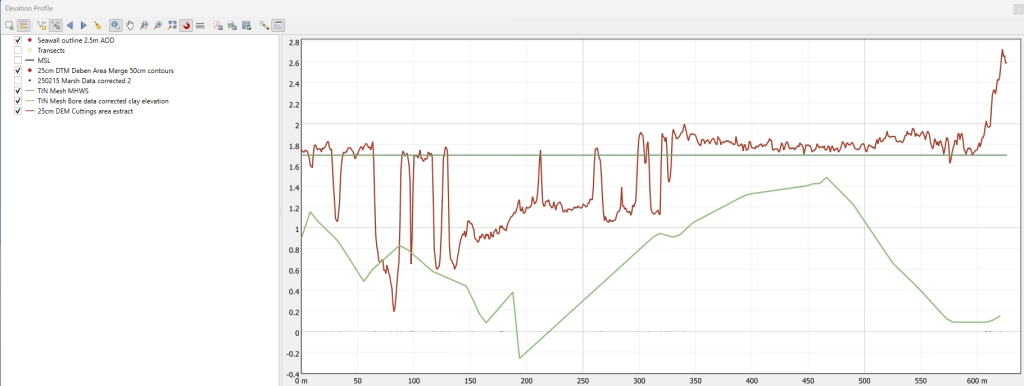
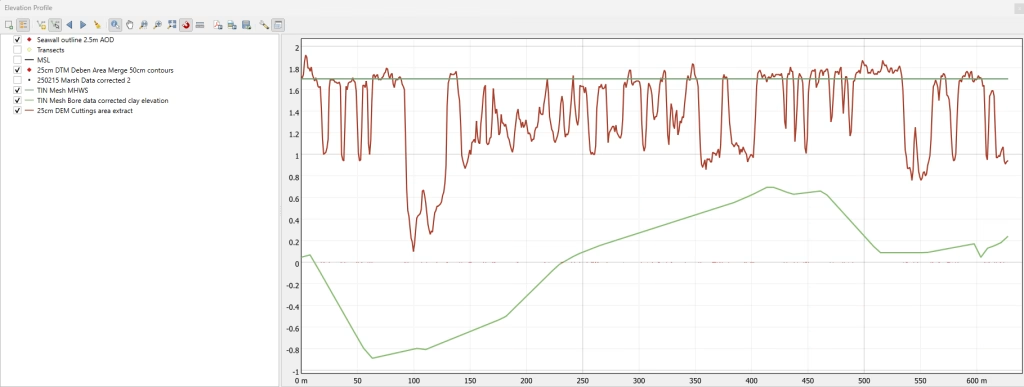
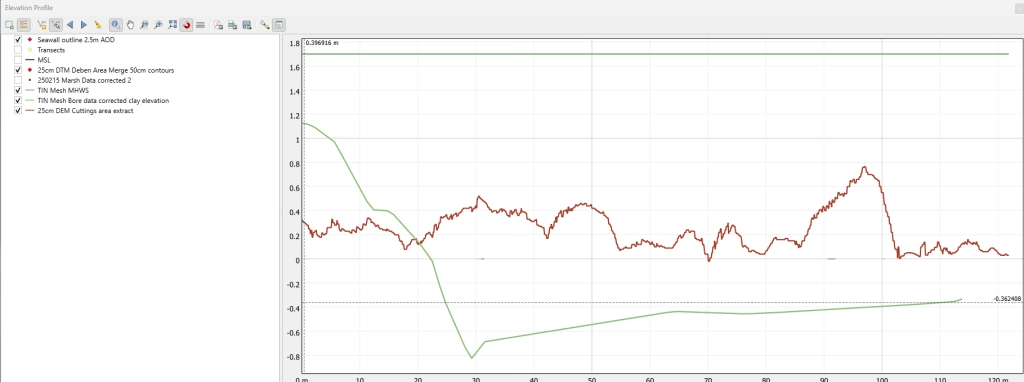
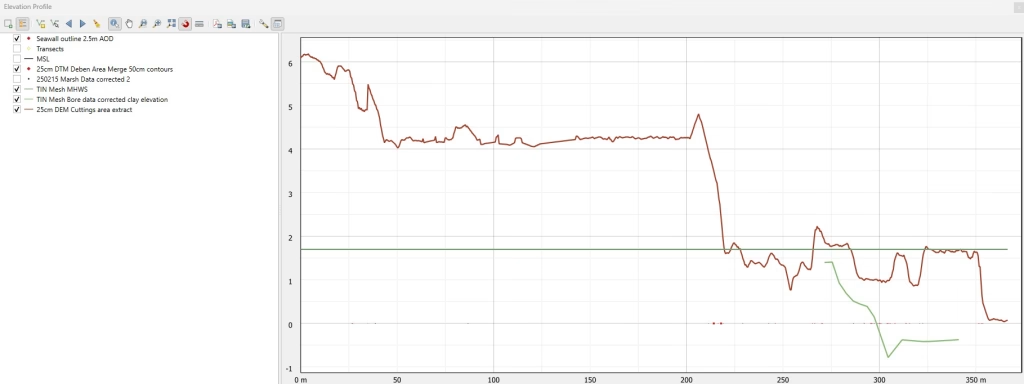
Elevations Shorelines
These run left to right along the shoreline with the ebb. The red line is the level of the marsh surface above OD. The straight line is MHWS and the green line is the level of the clay surface. It can be seen that the clay level rises downriver and then falls off again.
Accretion on Marsh
After a century or so, the marsh level should have increased due to accretion by 0.3 to 0.6m. Change to the depth of cut is unknown as the sea runs in and out again2See 6mm/yr accretion rate from Steward, Richard, and Robin Whittle. ‘Saltmarsh Research on the River Deben’, n.d. and- The rate of accretion in an artificially trapped lagoon area of the saltmarsh has resulted in a rise of the mud level of 15mm/year..
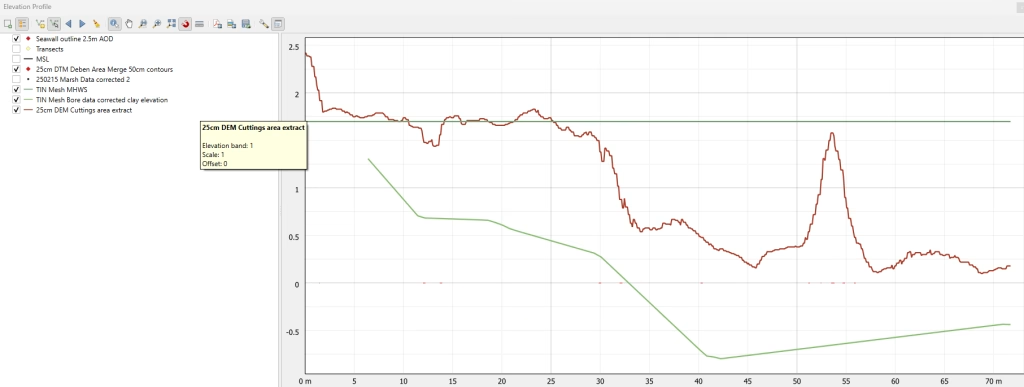
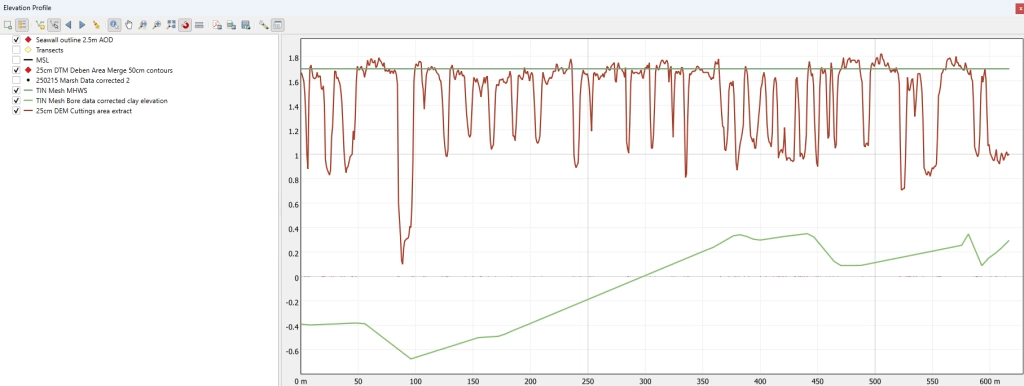
Elevations Channels
These run along the channels to the river. The red line is the level of the marsh surface above OD. The straight line is MHWS and the green line is the level of the clay surface.
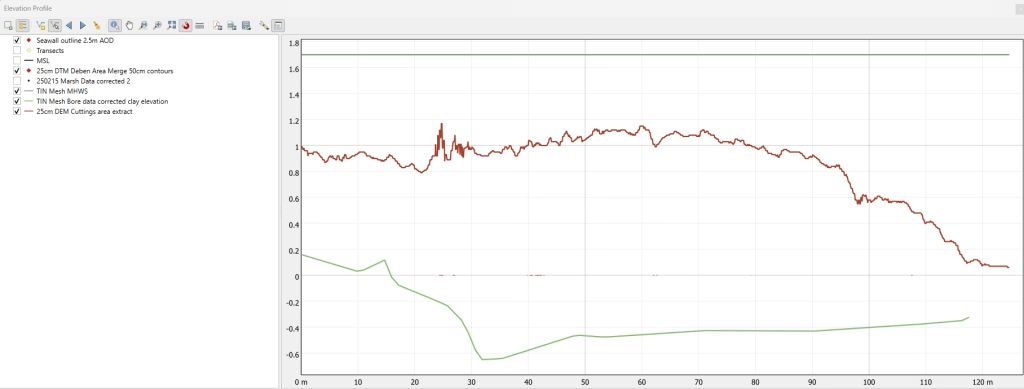
The channels at Hemley Marsh seem perhaps 0.5m deeper.
Accretion in Channels
Presumably, when the cuttings were dug the excavation was fairly level. Over a century or so, in sheltered areas, more mud will accrete than in areas that are well-washed by the tide. From the profiles, there is a drop from the shore end to mouth of each channel of about 0.8m which is less than that reported by an earlier trial3The rate of accretion in an artificially trapped lagoon area of the saltmarsh has resulted in a rise of the mud level of 15mm/yearSteward, Richard, and Robin Whittle. ‘Saltmarsh Research on the River Deben’, n.d. ..
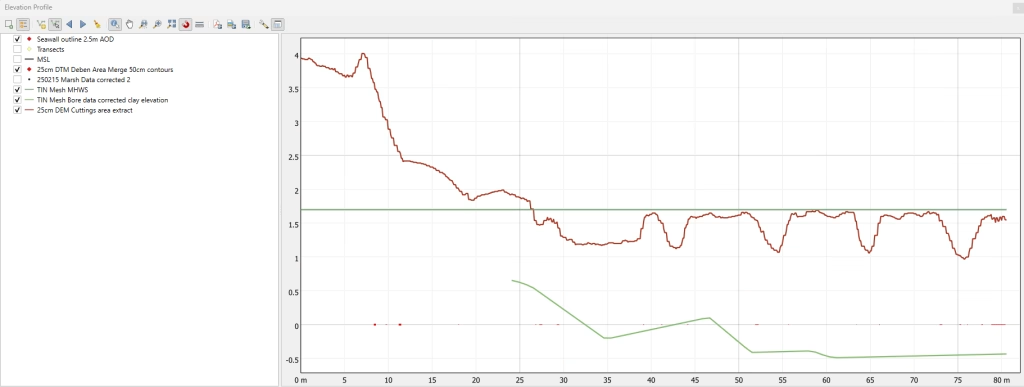
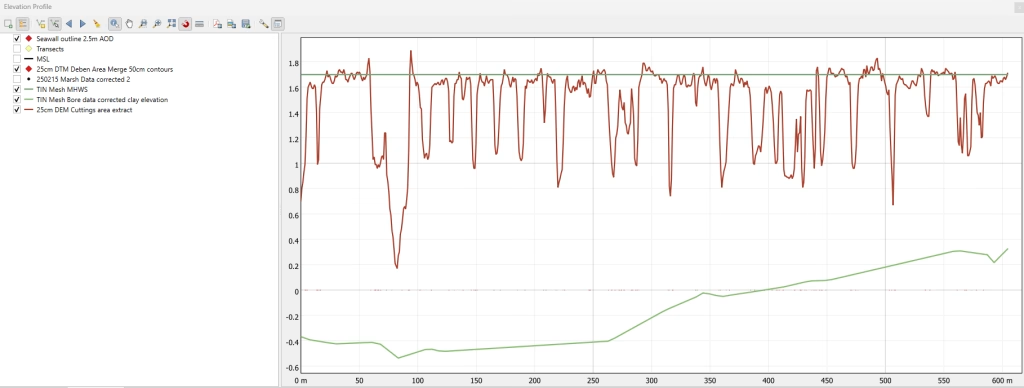
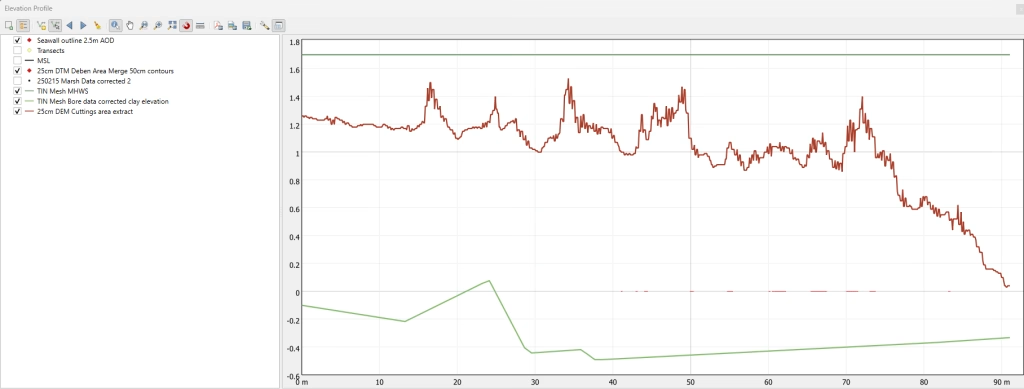
Elevations Creek
The land on which the reservoir was built was thought once to be a small creek leading to what was Hilton Hall (now Church Farm Cottage) next to the Church. The natural ground level is obscured by the reservoir and the level behind the sea wall is unknown. Three transects down the creek are shown.
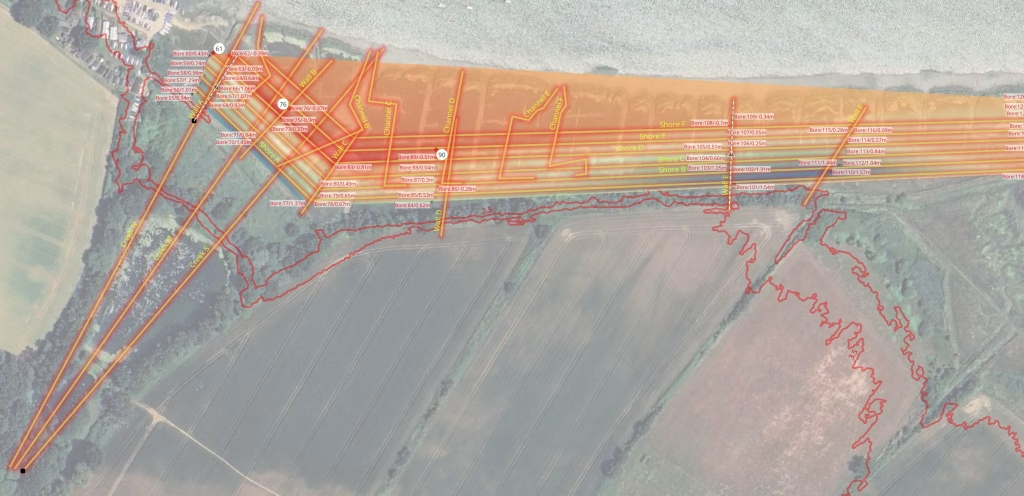

At what would have been the mouth of the creek leading to the reservoir, one might expect the clay level to be lower in the middle than on either side. There is a lower clay level between 100m-200m along transect Shore A which roughly aligns with the Central Creek. This may indicate that this was the original channel.
Questions
Next Steps
A series of bores could be made from the river along the shore. It might be possible to repeat the process in some areas on the land side, Dairy Marsh and Garden Field perhaps. This should give a good overall profile surface for the clay layer.
Notes
Sources
Footnotes
- 1Search for Land Based Designations / Site of Special Scientific Interest. The only one shown in the area is Waldringfield Pit on the BT site.
- 2See 6mm/yr accretion rate from Steward, Richard, and Robin Whittle. ‘Saltmarsh Research on the River Deben’, n.d. and- The rate of accretion in an artificially trapped lagoon area of the saltmarsh has resulted in a rise of the mud level of 15mm/year.
- 3The rate of accretion in an artificially trapped lagoon area of the saltmarsh has resulted in a rise of the mud level of 15mm/yearSteward, Richard, and Robin Whittle. ‘Saltmarsh Research on the River Deben’, n.d. .